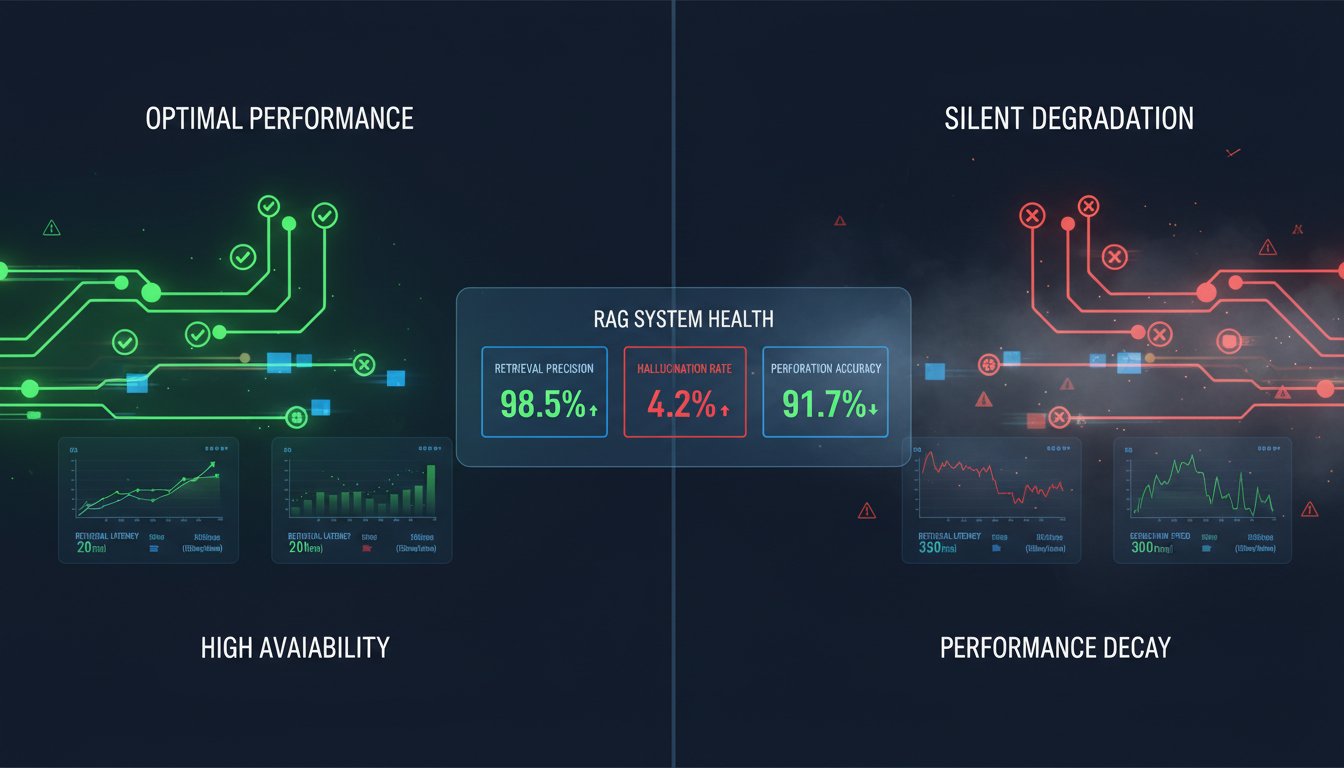
Imagine deploying a RAG system that feels like it’s working perfectly—your LLM generates coherent responses, your retrieval returns relevant documents, and your team ships it to production confident in the outcome. Six months later, you discover a silent degradation: retrieval precision has dropped 15%, hallucination rates are climbing, and your users are quietly getting worse answers. By the time you notice, the damage is done.
This scenario plays out at organizations across industries. According to recent enterprise data, 70% of RAG deployments lack systematic evaluation frameworks—meaning most teams are flying blind after launch. They measure neither retrieval quality nor generation accuracy in production, relying instead on anecdotal user feedback or periodic spot-checks. The result: RAG systems that degrade silently, teams that can’t diagnose failures, and executives questioning whether RAG was worth the investment at all.
The harsh reality is that RAG isn’t a “set it and forget it” technology. Unlike traditional software deployments where performance metrics are well-established, RAG systems operate in a gray zone where retrieval quality, generation faithfulness, and business impact are difficult to quantify. Without a measurement framework, you can’t distinguish between a system that’s performing well and one that’s slowly falling apart.
This post cuts through that ambiguity. I’ll show you exactly how to build an evaluation framework that works in production—not in academic papers. We’ll cover the metrics that matter, the benchmarks your enterprise should track, and the observability patterns that catch degradation before it impacts your users. By the end, you’ll have a concrete checklist to measure what actually drives RAG success.
The Three Layers of RAG Measurement: A Framework
Most enterprises evaluate RAG incompletely—they measure either retrieval quality or generation quality, but rarely both in concert. An effective measurement framework operates across three distinct layers, each with specific metrics and acceptance criteria.
Layer 1: Retrieval Quality (The Foundation)
Retrieval is where RAG succeeds or fails. If you’re retrieving irrelevant documents, no LLM can fix the outcome downstream. Yet retrieval quality is often the most neglected layer of measurement.
The core metrics for retrieval evaluation are:
Precision@k: What percentage of your top-k retrieved documents are actually relevant to the query? For enterprise RAG, precision@3 (top 3 results) is often more meaningful than precision@10, since users typically read only the first few results. A production-grade retrieval system should target 80%+ precision@3 for common query patterns.
Recall: Of all the relevant documents in your knowledge base, what percentage does your system retrieve within the top k results? This is trickier to measure in production (you’d need to label all relevant documents), but it’s critical for understanding false negatives. Enterprise RAG systems typically target 60-75% recall in real-world deployments—perfection isn’t necessary if precision is high.
NDCG (Normalized Discounted Cumulative Gain): This metric rewards correct ordering. A system that retrieves two relevant documents in positions 1 and 2 scores higher than one that retrieves them in positions 2 and 5. According to recent benchmarks, hybrid retrieval systems improve NDCG by 26-31% compared to dense-only search—a significant advantage for enterprise deployments. Track NDCG@5 and NDCG@10 as your ranking quality improves.
Mean Reciprocal Rank (MRR): How far down the ranking list must your system go before finding the first relevant document? MRR penalizes systems that bury critical information. An MRR above 0.7 indicates strong retrieval performance.
The practical implementation: Build a labeled test set of 200-500 queries with manually annotated relevant documents. Re-evaluate this test set monthly. If any metric drops >5% quarter-over-quarter, escalate immediately—it signals potential data degradation, embedding model drift, or configuration changes that need investigation.
Layer 2: Generation Quality (The Output)
Once retrieval delivers relevant context, the LLM must synthesize it into a faithful, accurate response. Generation quality has three key dimensions:
Faithfulness: Does the generated response accurately reflect the retrieved context? A system can generate grammatically perfect text that contradicts the source documents—that’s a hallucination, and it’s often worse than admitting uncertainty. Measure this by having a human reviewer (or a secondary LLM) validate whether key claims in the response are supported by the retrieved documents. Enterprise baseline: 90%+ faithfulness across your test set.
Answer Relevancy: Is the generated response actually answering the user’s question? This is distinct from retrieval relevancy. A system might retrieve perfectly relevant documents but generate a response that misses the mark. Use a combination of human review and LLM-as-judge approaches: submit (query, response) pairs to a grading model and track relevancy scores. Target 85%+ relevancy.
Context Precision: Of all the information the LLM included in its response, what percentage came from the retrieved context (versus the model’s training data)? This is increasingly important in regulated industries. You want to know when your system is reasoning from your knowledge base versus hallucinating from weights. Implement retrieval citations and track citation accuracy—if the LLM cites a document, verify that the cited information actually appears in that document. Enterprise standard: 95%+ citation accuracy.
Practical measurement: Allocate 2-3 hours per week for a human reviewer to sample 5-10 responses from your system. Track scores in a simple spreadsheet. As your test set grows, automate this with synthetic evaluations—services like Ragas or EvidentlyAI can score faithfulness and relevancy programmatically.
Layer 3: Business Impact (The Outcome)
Technical metrics are necessary but insufficient. RAG systems exist to solve business problems. Your measurement framework must connect technical metrics to business outcomes.
Resolution Rate: What percentage of user queries are fully resolved by your RAG system on the first attempt? This varies by use case (customer support might target 75%, while research assistance might accept 50%), but it’s the clearest proxy for business value. Track this through user feedback loops or task completion data.
Cost per Query: RAG systems incur embedding costs, vector database costs, and LLM inference costs. Calculate your true cost per query—including infrastructure overhead—and track it monthly. When precision improves, cost per query typically falls (you need fewer re-rankings or expansions). According to enterprise data, organizations report 25-30% operational cost reductions through optimized RAG, but only if they measure and iterate on cost explicitly.
User Satisfaction (CSAT): After each interaction, collect a simple binary rating: “Was this response helpful?” Aggregate weekly. This is your leading indicator for system degradation. If CSAT drops without corresponding drops in technical metrics, it often signals a mismatch between what you’re measuring and what users actually need.
Implementation approach: Embed a 1-click feedback mechanism in your RAG interface. Store feedback alongside query, response, and retrieval context. This creates a virtuous cycle: direct user signals inform which technical metrics matter most for your use case.
Building a Production Evaluation Pipeline
Having metrics is one thing. Observing them continuously in production is another. Most enterprises fail at the latter—they build great test sets but never instrument production to measure ongoing performance.
Step 1: Create a Baseline Test Set
Assemble 200-500 representative queries from your domain. For each query, manually label relevant documents and expected response characteristics (faithfulness requirements, complexity level, etc.). This baseline becomes your ground truth for comparison.
Investment: 40-60 hours of subject matter expertise (SME) time. This is non-negotiable. Without a labeled baseline, you’re measuring against nothing.
Step 2: Implement Continuous Retrieval Monitoring
For every production query, log:
– The query itself
– The documents retrieved (with rank positions)
– Retrieval scores (BM25 scores for sparse retrieval, similarity scores for dense retrieval)
– User feedback (if available)
Set up automated alerts: if median retrieval score drops >20% week-over-week, or if retrieval precision on your baseline test set falls below your threshold, notify your team. This catches drift before it cascades into user impact.
Step 3: Sample-Based Generation Evaluation
You can’t manually review every response, but you can systematically sample. Each week, randomly select 10 responses from your production system. Have a human reviewer score them on faithfulness, relevancy, and citation accuracy. Use this sample to estimate system-wide generation quality.
If your sample size is 10, you can estimate system quality within ±10 percentage points with 95% confidence. As your system grows, increase sample size proportionally.
Step 4: Track Metrics in a Central Dashboard
Unlike software engineering where dashboards track uptime and latency, RAG dashboards track retrieval precision, faithfulness, CSAT, and cost per query. Use tools like Prometheus, DataDog, or custom logging to feed metrics into a centralized visualization.
Your dashboard should answer these questions at a glance:
– Is retrieval quality stable? (precision@3, NDCG trends)
– Is generation quality stable? (faithfulness, citation accuracy)
– Is user satisfaction trending up or down? (CSAT, resolution rate)
– What’s the cost trend? (per-query cost, total infrastructure spend)
If any metric deviates >5% from baseline, the dashboard should highlight it immediately.
Real-World Benchmarks: What Enterprise Leaders Are Targeting
You now have a framework. But what are acceptable metrics?
Based on enterprise deployments across finance, healthcare, and legal sectors:
Retrieval Metrics: Hybrid retrieval systems (combining BM25 and semantic search) achieve precision@3 of 82-88%, NDCG@5 of 0.75-0.85, and recall of 65-75%. These are realistic targets for 2026 enterprise deployments. If you’re hitting these numbers, your retrieval is competitive.
Generation Metrics: Faithfulness benchmarks sit at 88-94% for production RAG systems. Lower faithfulness (85%) suggests your knowledge base isn’t specific enough or your LLM needs fine-tuning. Citation accuracy should be 95%+; anything lower indicates a need to improve grounding mechanisms.
Business Metrics: Resolution rates vary wildly by use case—customer support averages 70-75%, while internal research tools average 55-65%. Cost per query ranges from $0.01 (simple retrieval) to $0.50 (multi-stage ranking) depending on architecture complexity. User CSAT averages 72% across production systems, with leading implementations hitting 80%+.
The key insight: These aren’t universal targets. Your targets should reflect your use case, domain, and business constraints. But knowing the distribution of enterprise benchmarks helps you calibrate realistic expectations.
The Chunking Decision: Why It Matters for Evaluation
One variable often overlooked in measurement frameworks is chunking strategy—how you split documents into retrievable segments. Recent research indicates that chunking strategy can shift RAG accuracy by over 60%, yet few enterprises systematically evaluate it.
Here’s why: Two chunking strategies might yield identical precision@3 on your baseline test set but diverge wildly on new queries. Evaluate chunking performance across diverse query types—simple lookup queries, complex multi-document questions, and edge cases specific to your domain.
Implementation: Maintain multiple chunking strategies in parallel for a subset of production traffic (5-10%). Measure precision, faithfulness, and cost for each variant. Quarterly, evaluate whether your chunking strategy should evolve. This is unglamorous but essential—it’s where many 20-30% performance improvements hide.
From Measurement to Action: The Feedback Loop
Building a measurement framework is pointless without a feedback loop. Here’s how enterprise leaders close the loop:
Weekly (Individual Contributor Level): Review sample responses. Identify patterns in failures (e.g., “factual errors cluster around financial data”). Log these as issues for the retrieval engineering team.
Monthly (Team Level): Aggregate metrics. Compare this month to last month. If retrieval precision is dropping, investigate: Did the knowledge base change? Did embedding model drift? Did query patterns shift? Identify one to two root causes and prioritize fixes.
Quarterly (Leadership Level): Present business impact metrics. Show how retrieval improvements translated to cost savings or user satisfaction gains. Justify continued investment in RAG based on demonstrated value.
Without this feedback loop, metrics are just numbers. With it, they drive concrete improvements.
Avoiding the Evaluation Trap: Common Mistakes
Enterprises often sabotage their measurement frameworks with subtle errors:
Mistake 1: Measuring only what’s easy. Faithfulness is harder to measure than precision, so teams skip it. Consequence: You optimize for retrieving relevant documents but miss hallucinations. Measure everything that matters, even if it requires human review.
Mistake 2: Static test sets. You build a baseline test set once and use it forever. But your domain evolves—new document types emerge, query patterns shift. Refresh your test set quarterly. Add 20-30 new representative queries each cycle.
Mistake 3: Ignoring cost in evaluation. A system with 90% precision but $0.50 per query might be worse than one with 85% precision and $0.05 per query. Always evaluate the precision-cost trade-off. Sometimes, a faster system with slightly lower metrics is the right business choice.
Mistake 4: Not comparing against baselines. You need an “apples-to-apples” baseline. Before deploying hybrid retrieval, measure your dense-only system’s metrics. Before switching LLMs, establish current generation quality. Without before/after comparisons, you can’t prove impact.
These mistakes are common because they’re easy to overlook in the rush to deploy. Catch them upfront.
Your Next Steps: Building the Framework
You now have the foundation for a production-grade RAG evaluation framework. Here’s your action plan:
This Week:
1. Identify 3-5 stakeholders (retrieval engineer, LLM engineer, product lead) and align on business success metrics. What outcome matters most: cost reduction? Higher quality? Faster resolution?
2. Define your baseline test set size and start assembling representative queries. Allocate SME time.
This Month:
1. Build your baseline test set (200-500 labeled queries).
2. Establish baseline metrics on your current RAG system. This is your ground truth.
3. Choose a monitoring tool (Prometheus, DataDog, or custom) and begin logging production metrics.
This Quarter:
1. Instrument continuous evaluation on your baseline test set. Set alert thresholds (e.g., precision@3 < 80%).
2. Implement sample-based generation evaluation (10 responses per week, human-scored).
3. Build your dashboard. Ensure leadership can see retrieval, generation, and business metrics at a glance.
The organizations winning with RAG aren’t smarter than their competitors—they’re just more disciplined about measurement. They know their systems are degrading the moment it starts. They iterate based on data, not intuition. They can prove ROI because they measure it relentlessly.
Your measurement framework is the difference between RAG as a technology experiment and RAG as a core business capability. Build it intentionally, measure continuously, and let the data guide your evolution.