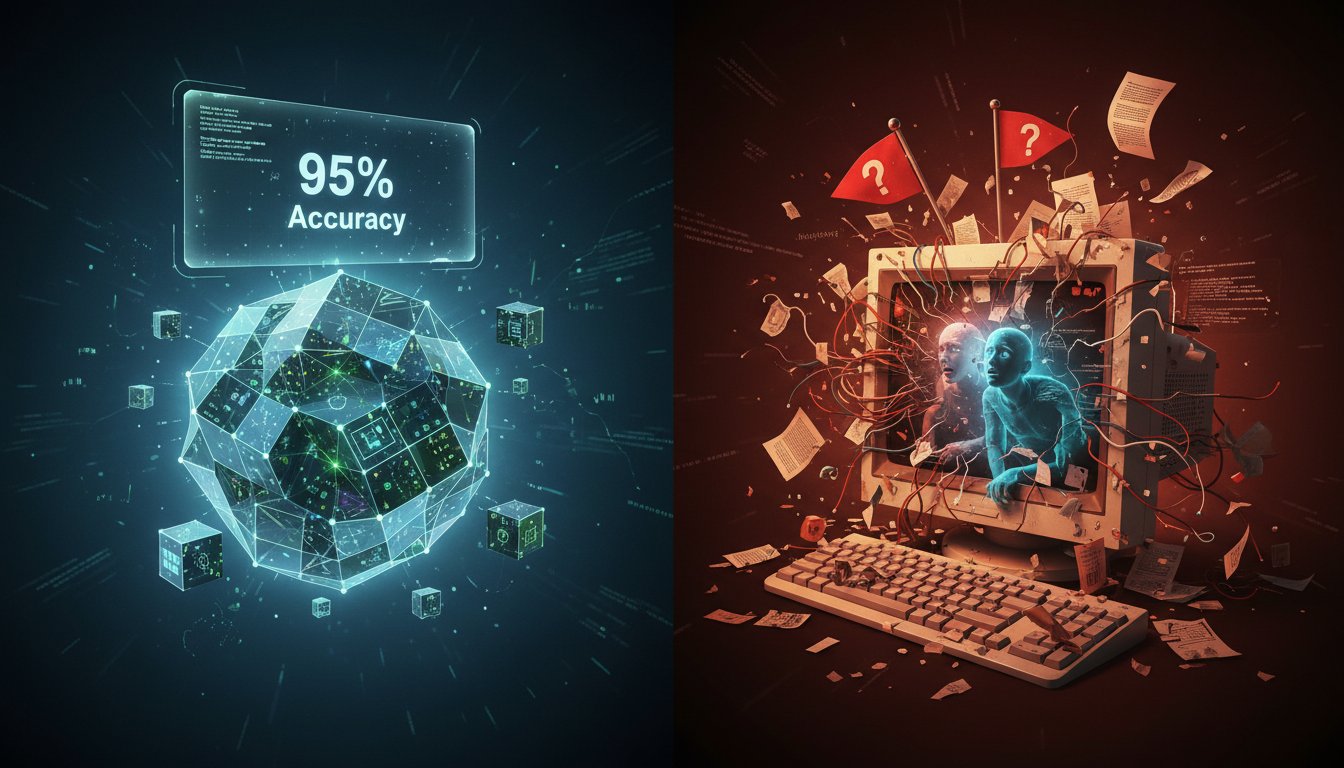
Imagine you’ve just rolled out your enterprise RAG system after months of development. Your RAGAS scores are pristine: 95% retrieval accuracy, 92% answer relevancy. Your team celebrates. Then the first support tickets arrive. Users are frustrated. Answers are contextually correct but practically useless. The internal knowledge base is filling with contradictory information. Your perfect metrics are telling a beautiful lie while the business reality is a costly mess.
This is the hidden crisis in enterprise AI today. Automated evaluation frameworks like RAGAS, DeepEval, and Arize Phoenix have become industry standards, yet they create a dangerous illusion of success. They measure what’s easy to measure: cosine similarity, token overlap, answer faithfulness. What they miss completely is whether the system actually solves real business problems, adapts to evolving knowledge, and delivers a return on investment. Teams ship systems that pass every automated test while failing their users.
There’s a better way. The next evolution isn’t about better automated metrics. It’s about building closed-loop feedback systems that combine quantitative scores with qualitative human signals, track real-world cost and latency, and create a continuous cycle of improvement. It requires shifting from a development-centric evaluation model to a production-obsessed observability framework. That’s how you move from shipping AI that looks good on paper to deploying AI that delivers tangible business value.
Why Your RAGAS Scores Are Lying to You
Automated RAG evaluation frameworks operate on a fundamental mismatch: they assess static snapshots of performance while enterprise knowledge is dynamic and user needs are contextual. Your 95% retrieval accuracy score might reflect perfect matches against last month’s document corpus, but it says nothing about whether the retrieved information is still correct, whether it conflicts with newer data, or whether it’s the most useful piece of information for the user’s specific intent.
The Static Knowledge Fallacy
Enterprise knowledge isn’t a fixed dataset. Product specifications change. Internal policies get updated. Market conditions shift. A RAG system evaluated on a static benchmark is fine-tuned for a reality that no longer exists the moment it goes live. As Eugene Yan, Applied AI Lead, notes, “Static retrieval is a bottleneck. The next wave of enterprise RAG isn’t about better vectors, it’s about dynamic routing, self-querying agents, and semantic caching that adapt to query intent in real-time.” Evaluation has to account for this temporal drift.
Consider a technical support RAG querying product documentation. An automated metric might correctly identify a chunk about “error code 504” from a troubleshooting guide. But if that guide was updated yesterday to deprecate the old fix and recommend a new one, the system retrieved a perfectly accurate but dangerously outdated answer. Your RAGAS score stays high while user frustration spikes.
The Context Blind Spot
Current metrics fail to evaluate answer utility. An answer can be “faithful” to the source (not hallucinated) and “relevant” to the query (semantically matched) yet still be completely useless. A query asking “How do I configure the API rate limit?” might retrieve a chunk defining what a rate limit is: factually correct, contextually irrelevant. The user needed steps, not a definition. Automated frameworks don’t have the semantic nuance to catch this.
Building a Closed-Loop Evaluation Framework That Actually Works
To escape the evaluation trap, you need a multi-signal framework that connects automated metrics to business outcomes. This isn’t about throwing out RAGAS. It’s about augmenting it with human feedback, cost tracking, and behavioral analytics to get a true picture of system health.
Signal 1: Augment Automated Metrics with Human-in-the-Loop Feedback
Automated scores give you a baseline. Human feedback gives you ground truth. The key is making it effortless for users to share that feedback and piping it directly back into your evaluation pipeline.
Implementation Playbook:
1. Embed Feedback Mechanisms: Add clear “Was this helpful?” (Thumbs Up/Down) buttons to every RAG response in your UI. For critical applications, add a free-text “What was wrong?” field.
2. Create a Feedback Taxonomy: Tag negative feedback with reasons: “Outdated Information,” “Missing Context,” “Too Verbose,” “Wrong Source.” This structured data is invaluable for root cause analysis.
3. Correlate Feedback with Metrics: Build a dashboard that shows RAGAS scores side-by-side with user correction rates. If retrieval accuracy is 95% but the “Wrong Source” feedback rate is 30%, you have a critical gap your automated suite missed entirely.
As Dr. Arun K. Sharma, Enterprise AI Architect, stated in a recent Gartner panel: “RAG evaluation is broken when it only measures retrieval accuracy. Enterprises need closed-loop feedback systems that track user correction rates, fallback triggers, and cost-per-query to measure true ROI.”
Signal 2: Track Production Economics, Cost and Latency
A RAG system that provides perfect answers at $10 per query and 5-second latency is a business failure. Evaluation has to include the economic and performance dimensions of production.
Key Metrics to Instrument:
– Cost-per-Query: Track average LLM token consumption (input and output) per query. Break it down by retriever type (vector, keyword, hybrid) and LLM call (initial answer, re-ranking, refinement).
– p95/p99 Latency: Measure time-to-first-token and total response time. According to the Weaviate Enterprise Performance Index, fine-tuned pipelines with hybrid search and caching achieve 0.6 to 1.2 second p95 latency, while naive vector-only retrieval sits at 2.5 to 4.0 seconds.
– Cache Hit Rate and Savings: If you’re using semantic caching (which Lance Martin notes can drive 40 to 60% inference cost reduction), monitor your cache hit rate and the actual cost savings it delivers.
Signal 3: Measure Behavioral Outcomes and Fallback Triggers
How users interact with the system tells the real story. Are they asking follow-up questions? Are they immediately rephrasing queries after a poor answer? Is your deterministic fallback, something like “I couldn’t find an answer, here’s a link to the knowledge base,” being triggered constantly?
Critical Behavioral KPIs:
– Session Success Rate: The percentage of user sessions that end with a “Thumbs Up” or no query rephrasing.
– Fallback Trigger Rate: How often your system admits defeat. A high rate points to retrieval gaps or poorly tuned confidence thresholds.
– User Correction Rate: The rate at which users submit corrections or “Wrong Source” feedback. This is your most direct signal that the evaluation framework is falling short.
From Evaluation to Observability: The Production Dashboard
Pulling these signals together requires a shift from an evaluation report to an observability dashboard. This is a living system that monitors health in real-time.
Architecture of a RAG Observability Dashboard:
1. Ingestion Layer: Collects logs from your RAG pipeline (queries, retrieved chunks, sources, LLM calls), user feedback events, and infrastructure metrics (latency, cost).
2. Metrics Computation Layer: Calculates automated scores (RAGAS, etc.), correlates them with feedback tags, and computes cost-per-query and latency distributions.
3. Visualization and Alerting Layer: A dashboard showing:
– Accuracy Health: RAGAS scores trended over time, overlaid with user correction rate.
– Business Health: Cost-per-query trend, session success rate.
– Performance Health: p95 latency, cache hit rate.
– Alerting: Set alerts for correction rate spikes, cost anomalies, or latency degradation.
This dashboard becomes the single source of truth for your AI engineering, product, and business teams, aligning everyone on what “good” actually means.
The Compliance Imperative: Auditing Your RAG Pipeline
For regulated industries, evaluation isn’t just about performance. It’s about compliance. The EU AI Act and NIST AI RMF guidelines demand transparency and auditability.
Building an Audit Trail:
– Source Attribution: For every answer, immutably log the exact document chunks used, their source IDs, and retrieval scores.
– Pipeline Decision Logging: Log why a particular retriever or route was chosen, for example, “Hybrid search selected due to query containing technical term ‘OAuth’.”
– Human Feedback Logging: Store all user corrections and feedback with timestamps, forming part of your model improvement record.
This audit trail proves your system’s reliability, provides evidence for compliance, and creates a rich dataset for fine-tuning and pipeline improvement.
Moving beyond broken RAG evaluation is the single most important step toward real ROI from enterprise AI. It requires the humility to admit that automated metrics, while necessary, aren’t sufficient on their own. The winning approach combines the scalability of automated evaluation with the ground truth of human feedback, the pragmatism of cost tracking, and the rigor of behavioral analysis.
Start by instrumenting one new signal. Add user feedback buttons to your UI and correlate the results with your RAGAS scores. The gap you discover will be eye-opening. Then build out your cost-per-query tracking. Finally, pull these streams into a unified observability dashboard that tells the true story of your RAG system’s impact. That’s the path from shipping AI that looks good in a demo to deploying AI that delivers undeniable business value. The real measure of success isn’t a score on a dashboard. It’s the absence of frustrated support tickets and the presence of tangible efficiency gains.
Ready to fix your evaluation gap? Start by auditing your current metrics against real user feedback. Download our free RAG Observability Checklist to identify the critical signals you’re missing and build a dashboard that shows the truth.