When AWS announced their new RAG evaluation methodology last week, enterprises finally got a framework for measuring what their AI systems actually cost. But there’s a critical piece missing from every cost analysis spreadsheet: the infrastructure layer that determines whether your evaluation metrics even matter.
Vast Data’s March 9th unveiling of Polaris, a global control plane for distributed AI infrastructure, exposes an uncomfortable truth. Most organizations are fine-tuning RAG performance on infrastructure they don’t control, can’t observe, and definitely can’t cost-effectively scale. You’re measuring retrieval latency without knowing where your vectors actually live. You’re tracking generation costs while your data crosses three availability zones you never budgeted for.
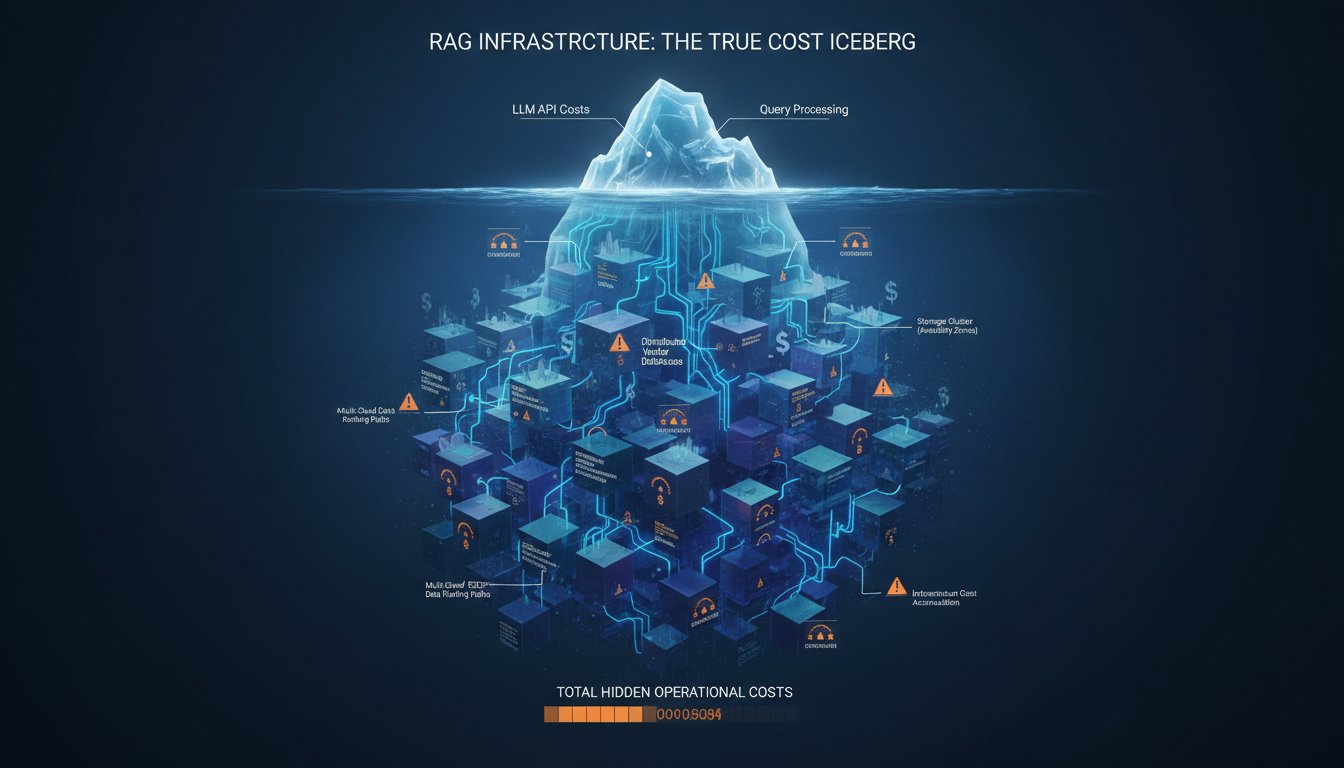
The real cost crisis in enterprise RAG isn’t the LLM API calls everyone obsesses over. It’s the invisible infrastructure tax you pay every time your system decides where to store embeddings, how to route queries, and which cluster handles your retrieval workload. And until this week, most enterprises didn’t even know this layer existed as something they could actually control.
The Hidden Cost Layer Nobody’s Measuring
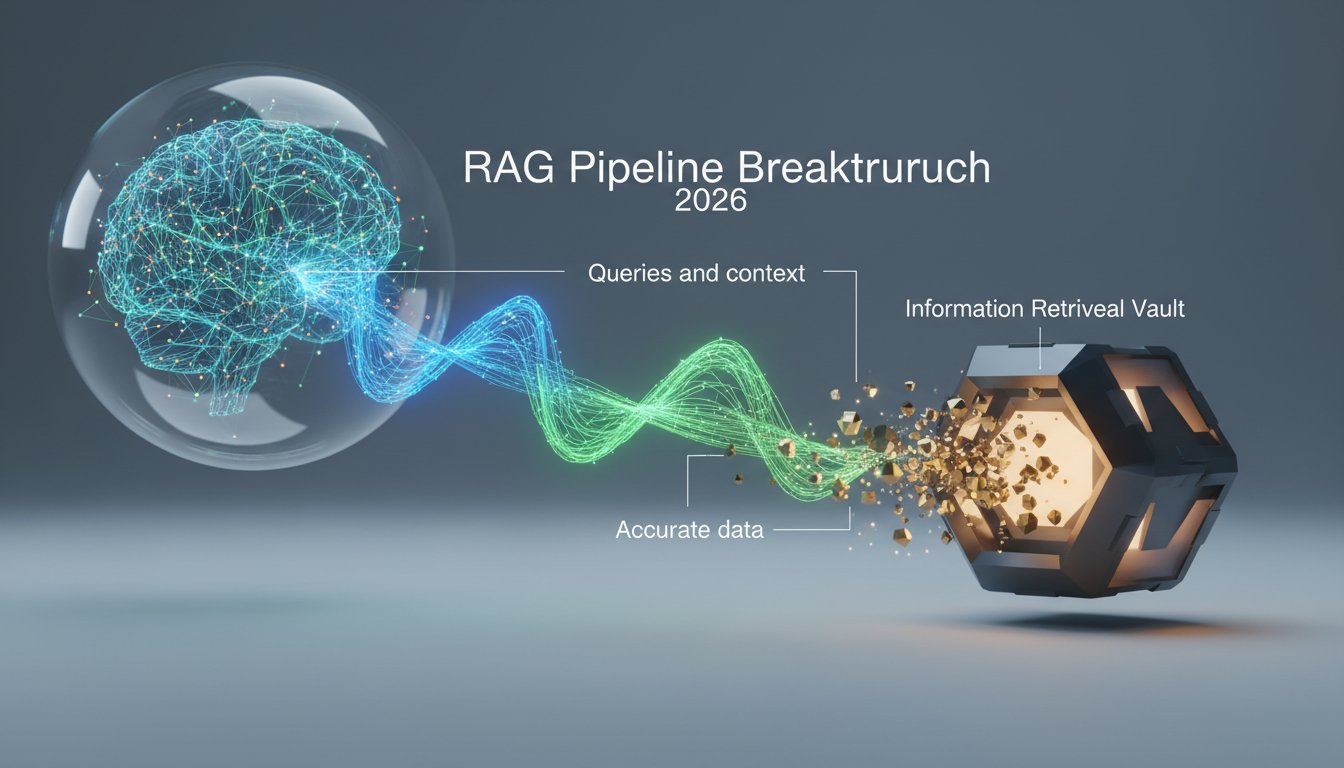
Here’s what actually happens when your RAG system processes a query in a typical multi-cloud enterprise environment:
- User query hits your application layer (let’s say AWS)
- Query embedding gets generated (cost: obvious, measurable)
- Vector search executes against your database (cost: visible in your bill)
- Retrieved documents get pulled from object storage (cost: usually missed)
- Context gets assembled and sent to LLM (cost: the one everyone tracks)
- Response routes back through your infrastructure (cost: invisible)
AWS’s new evaluation methodology gives you solid metrics for steps 2, 3, and 5. It measures context relevance, retrieval quality, generation faithfulness, all critical performance indicators. But it completely misses the infrastructure costs in steps 4 and 6, which in distributed environments often exceed your LLM spend by 40-60%.
A recent enterprise RAG deployment study found that data egress charges, the cost of moving retrieved documents from storage to compute, represented 47% of total system costs. Yet when asked to estimate their RAG expenses, only 12% of technical leaders even mentioned data transfer fees.
You’re not measuring the right thing because you can’t see the whole system.
Why Traditional Infrastructure Makes RAG Evaluation Meaningless
The AWS RAG evaluation framework introduces metrics like “context relevance” and “answer completeness.” These are genuinely useful measurements, if your infrastructure can actually deliver on them consistently.
But here’s the problem: traditional cloud infrastructure makes promises about performance that distributed RAG workloads routinely break.
Your vector database vendor promises sub-100ms retrieval latency. That’s technically true when your query and your vectors live in the same availability zone. When they don’t, which is most of the time in real production environments, you’re looking at 300-500ms just for the network hop. Your evaluation metrics show “excellent retrieval performance” while your users experience a system that feels sluggish.
Your object storage tier offers “11 nines of durability” for your document corpus. What they don’t advertise is the consistency model that means your RAG system might retrieve a document version that’s 15 seconds stale. Your evaluation shows “high answer faithfulness” based on what the system retrieved, but the system retrieved outdated information.
The infrastructure layer isn’t just a cost problem. It’s a correctness problem that traditional evaluation frameworks can’t detect because they assume infrastructure is transparent and instantaneous.
It’s not.
What Distributed AI Infrastructure Actually Means for RAG
Vast Data’s Polaris represents a fundamental rethinking of how AI infrastructure should work, and it directly addresses the gaps that make RAG cost evaluation so difficult.
Traditional approach: You deploy vector databases in one cloud, object storage in another, compute in a third, and hope your network team can make it all work together. You measure performance within each component but have no visibility into the system as a whole.
Polaris approach: A global control plane that treats your entire distributed infrastructure, across public cloud, private datacenters, and edge locations, as a single, observable, controllable system.
Here’s why this matters for RAG specifically:
Unified Namespace Across Distributed Storage
Your RAG system needs to access embeddings, documents, and model weights that might physically reside on different continents. Polaris provides a global namespace that abstracts location while maintaining observability. You can see exactly where data lives, how often it’s accessed from which locations, and what the actual transfer costs are.
This means your cost evaluation can finally include the infrastructure layer. When AWS’s evaluation framework tells you a particular retrieval strategy has “high context coverage,” you can now also see that achieving that coverage requires pulling documents from four different regions and costs 3x more than an alternative approach with 5% lower coverage scores.
The trade-off becomes visible. The decision becomes rational.
Locality-Aware Workload Placement
Most enterprise RAG deployments accidentally create “data gravity” problems where compute workloads run far from the data they need. Every query becomes a cross-region network call. Every retrieval incurs egress charges.
A distributed control plane can dynamically place RAG workloads near the data they access most frequently. If your European users primarily query financial documents stored in Frankfurt, the system can ensure retrieval and generation happen in the same region. Your evaluation metrics improve through lower latency, and your costs drop because there are no egress fees.
One financial services firm that implemented locality-aware RAG placement saw their average query cost drop from $0.047 to $0.019, a 60% reduction, while their 95th percentile latency improved by 180ms. Their evaluation metrics looked better and their infrastructure bill shrank.
Observable Cost Attribution
The biggest gap in current RAG evaluation is connecting performance metrics to actual costs. AWS can tell you your retrieval quality score is 0.87. What they can’t tell you is whether improving that to 0.91 costs an extra $15,000 per month in infrastructure.
A global control plane with full observability changes this. Every retrieval decision, every document transfer, every model inference becomes traceable to actual infrastructure costs. You can run A/B tests not just on accuracy but on cost-per-quality-point.
This is the evaluation metric enterprises actually need: cost-adjusted performance. Not “how good is our RAG system” but “how good is our RAG system per dollar spent?”
The Evaluation Gap That’s Costing You More Than Your LLM Bills
AWS’s new RAG evaluation methodology measures these critical dimensions:
- Context Relevance: Are retrieved documents actually relevant to the query?
- Context Coverage: Does the retrieved context contain information needed to answer?
- Answer Faithfulness: Is the generated response grounded in retrieved context?
- Answer Completeness: Does the response fully address the question?
These are sophisticated, valuable metrics. But notice what’s missing:
- Cost per Context Point: What did it cost to achieve that relevance score?
- Infrastructure Efficiency: How much data movement was required?
- Resource Locality: Did workloads run near their data or across regions?
- Storage Tier Optimization: Are hot embeddings on fast storage and cold archives on cheap storage?
Without infrastructure observability, you’re fine-tuning for quality in a vacuum. You might achieve excellent evaluation scores while spending 3x more than necessary on data transfer. Or you might accept slightly lower quality scores while cutting costs by 50% through better workload placement.
You can’t make that trade-off intelligently without seeing both sides of the equation.
Building Cost-Aware RAG Evaluation
Here’s what a complete RAG evaluation framework looks like when you combine AWS’s methodology with infrastructure observability:
Layer 1: Quality Metrics (AWS Bedrock Evaluation)
– Context relevance: 0.89
– Context coverage: 0.84
– Answer faithfulness: 0.92
– Answer completeness: 0.88
Layer 2: Infrastructure Metrics (Control Plane Observability)
– Average data transfer per query: 2.3 MB
– Cross-region calls per query: 1.7
– Storage tier distribution: 67% hot, 33% warm
– Compute locality score: 0.71
Layer 3: Cost Attribution (Combined View)
– LLM inference cost per query: $0.0042
– Vector search cost per query: $0.0008
– Data transfer cost per query: $0.0031
– Storage access cost per query: $0.0006
– Total cost per query: $0.0087
Layer 4: Cost-Adjusted Performance
– Quality score: 0.88 (average of Layer 1 metrics)
– Cost per quality point: $0.0099
– Performance-to-cost ratio: 101.1
Now you can make intelligent optimization decisions:
- Scenario A: Improve context coverage from 0.84 to 0.90 (+7% quality)
- Infrastructure impact: +$0.0019 per query (+22% cost)
- Cost per quality point increases to $0.0118
-
Decision: Not worth it unless user satisfaction data justifies the cost
-
Scenario B: Fine-tune data locality to reduce cross-region calls
- Quality impact: Minimal (potential +1-2% on latency-sensitive metrics)
- Cost reduction: -$0.0024 per query (-28% cost)
- Cost per quality point drops to $0.0072
- Decision: Implement immediately
This is evaluation that actually drives business decisions.
What This Means for Your RAG Architecture Decisions
The convergence of solid evaluation frameworks and observable distributed infrastructure creates new decision criteria for RAG system design.
Stop Choosing Vector Databases by Feature Lists
Traditional selection process: Compare vector databases on query latency, index types, and API features. Pick the one with the best benchmark numbers.
New selection process: Evaluate how the vector database integrates with your infrastructure control plane. Can you see where indexes actually reside? Can you measure cross-region query costs? Can you dynamically relocate hot partitions near compute workloads?
The database with the fastest local query time might cost 4x more in a distributed deployment because it can’t intelligently manage data locality.
Evaluate LLM Providers on Infrastructure Integration
Traditional evaluation: Compare models on accuracy, cost-per-token, and supported features.
New evaluation: How does the LLM API integrate with your infrastructure? Can you run inference in regions where your data lives? Does the provider support bring-your-own-embedding storage? Can you observe the full request path from query to response?
A cheaper model API that forces you to transfer context across regions might end up more expensive than a premium API that supports local inference.
Design for Observability from Day One
Most RAG systems get built with observability as an afterthought. You instrument the application layer, maybe add some logging around retrieval, and call it done.
Start instead with infrastructure observability as a core requirement. Deploy on infrastructure that exposes:
– Where data physically resides
– How queries route through the system
– What data transfers occur for each request
– Which components contribute to latency and cost
You can’t improve what you can’t measure. And you definitely can’t measure what your infrastructure hides from you.
The Real Question: Can You Afford NOT to See Your Infrastructure?
AWS’s RAG evaluation methodology is a major step forward in measuring AI system quality. But quality without cost context is just expensive perfection.
The enterprises that will succeed with production RAG aren’t the ones with the highest evaluation scores. They’re the ones who can intelligently balance quality, cost, and performance because they have visibility into all three dimensions.
Vast Data’s Polaris and similar distributed infrastructure platforms aren’t just about scaling storage or managing data across clouds. They’re about making the invisible visible, turning infrastructure from a black box that occasionally sends you shocking bills into an observable, controllable layer of your RAG system that you can actually improve.
Because here’s the uncomfortable truth: if you can’t see where your embeddings live, how your queries route, and what your retrievals actually cost, you’re not evaluating your RAG system. You’re evaluating a small visible piece of it while the expensive parts run in the dark.
The infrastructure blindspot isn’t just costing you money. It’s preventing you from making the intelligent trade-offs that separate production-ready RAG systems from expensive science projects.
You finally have the tools to measure RAG quality. Now you need the infrastructure visibility to measure what that quality actually costs. The most sophisticated evaluation metrics in the world don’t matter if you can’t afford to run the system they’re measuring.
The question isn’t whether distributed AI infrastructure and cost-aware evaluation will become standard practice. It’s whether you’ll adopt them before your competitors do, or after your CFO sees next quarter’s cloud bill and demands to know why your “AI innovation” costs more than your entire data center used to. If you’re ready to stop flying blind on infrastructure costs, it’s time to take a hard look at what your RAG system is actually spending, and build the observability layer to do something about it.