Enterprise RAG implementations often stumble at the same junction: the moment finance leadership asks, “What’s this actually costing us?” Organizations racing to deploy retrieval-augmented generation systems frequently discover they’ve been calculating ROI like they’re still in 2023, using outdated cost models that ignore the infrastructure realities of production RAG at scale.
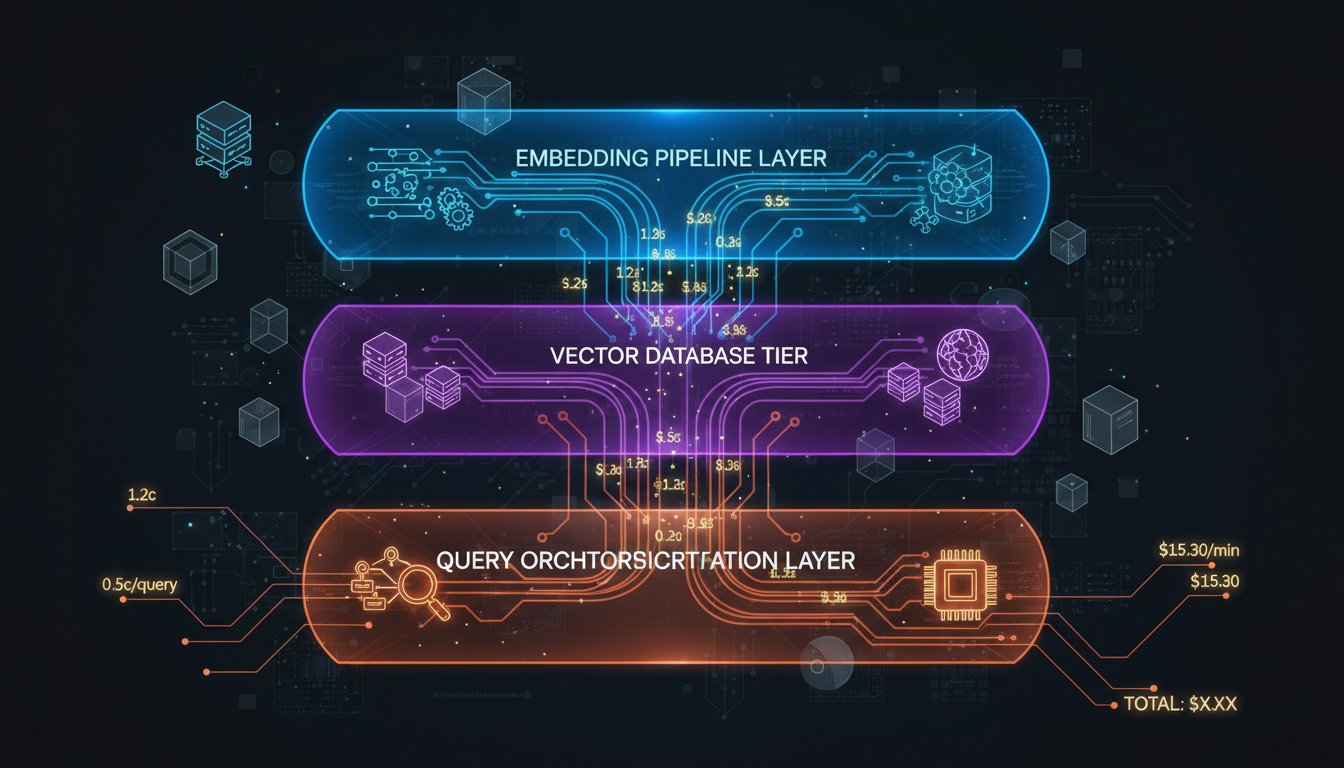
The problem isn’t unique to RAG. Every emerging technology follows this pattern—initial enthusiasm drives deployment, then operational reality crashes the party. But RAG’s cost structure is particularly deceptive because the expenses hide across three distinct silos that most finance teams never connect: the embedding pipeline, the vector database tier, and the query orchestration layer. A manufacturing company we spoke with spent $400,000 deploying a RAG system only to discover their true monthly operational cost was $18,000—more than double their initial projections. They’d missed the compounding costs of embedding generation, reranking infrastructure, and the persistent compute required to maintain sub-500ms retrieval latency across a 50-billion-token knowledge base.
This gap between projected and actual RAG costs is costing enterprises billions in miscalculated investments. Organizations either kill promising projects because they appear too expensive, or continue funding inefficient implementations because they’re not measuring the right variables. The solution isn’t complex; it requires mapping the actual cost architecture of modern RAG systems and building financial models that account for the complete technology stack.
Let’s break down where the hidden expenses actually live in enterprise RAG, how to calculate them with precision, and the optimization strategies that turn RAG from a budget hemorrhage into a legitimate competitive advantage.
The Three-Layer Cost Architecture Nobody’s Talking About
Most cost analyses treat RAG as a single line item. In reality, enterprise RAG deployments consist of three interdependent cost layers, each with distinct scaling economics and optimization opportunities.
The Embedding Pipeline: Your Perpetual Compute Tax
Embedding generation is where many cost projections first diverge from reality. Organizations typically calculate embedding costs as a one-time event—”We’ll embed our knowledge base once, and we’re done.” This assumption collapses the moment you acknowledge that enterprise knowledge bases aren’t static.
Legal documents receive amendments. Product specifications get updated. Compliance regulations shift. Every time your source data changes, you’re re-embedding affected documents. A financial services firm with 500,000 compliance documents processing 2,000 document updates monthly faces continuous re-embedding. Using OpenAI’s embedding API at $0.02 per 1M tokens, that’s roughly $600-$1,200 monthly just in perpetual re-embedding costs—a variable that rarely appears in initial ROI calculations.
But there’s a deeper layer: embedding model choice directly determines this cost structure. Organizations typically choose between three approaches:
Proprietary APIs (OpenAI, Cohere, Anthropic) offer convenience but create long-term cost liabilities. You’re betting on vendor pricing remaining stable. A manufacturing company embedding 10 billion tokens monthly through OpenAI’s API would spend $200,000 annually—a number that scales with their knowledge base growth.
Open-source embedding models (Sentence Transformers, Nomic Embed) deployed on your infrastructure shift costs to compute but eliminate per-query fees. Running Nomic Embed on a dedicated GPU instance (~$0.50/hour) for inference across a billion-token corpus costs roughly $4,000-$6,000 monthly, but you own the economics and can optimize the pipeline.
Hybrid approaches use lightweight embeddings for initial retrieval, then invoke expensive cross-encoder rerankers only on the top-k candidates. This significantly reduces total embedding costs while improving accuracy.
The critical variable most organizations miss: embedding drift. As your knowledge base ages, embeddings become stale. Healthcare organizations need fresh embeddings when new treatment protocols emerge. Legal firms need updated embeddings when regulatory standards change. This ongoing cost compounds and is often invisible in traditional ROI models.
The Vector Database Tier: Storage That Scales Differently Than You Expect
Vector database pricing confuses enterprise procurement teams because it operates on a completely different cost model than traditional databases. You’re not paying for query volume—you’re paying for storage, dimensionality, and the underlying infrastructure that maintains index performance.
Consider a mid-sized enterprise RAG system:
- 50 million documents averaged at 500 tokens each = 25 billion tokens
- 1,536-dimensional embeddings (standard for many models)
- Storage requirement: ~380 GB of raw vector data
Vector database pricing typically breaks down as:
- Managed services (Pinecone, Weaviate Cloud): $0.30-$2.00 per million vectors monthly, plus API query costs ($0.10-$0.50 per 1M queries)
- Self-hosted (Milvus, Qdrant on cloud VM): Base compute ($500-$2,000/month for a production instance) plus storage ($10-$50/month for 380 GB)
- Hybrid cloud (Elasticsearch vector search): Pay-as-you-go compute pricing ranging $0.15-$0.40 per hour
But raw storage isn’t the complete picture. Vector databases maintain multiple index structures to achieve sub-millisecond query latency. These indexes consume 2-4x the raw vector size, meaning your 380 GB knowledge base actually occupies 760-1,520 GB of index space. Replication for high availability doubles this again.
A financial services firm storing 100 million document vectors discovered their true database cost was $8,000 monthly—not the $2,000 projected in their ROI model. They hadn’t accounted for: replication overhead (50% additional cost), index maintenance during peak embedding updates (20% overhead), and the compute infrastructure required to handle concurrent retrieval at 1,000 queries per second.
The Query Orchestration Layer: The Invisible Compute Tax
This is where the cost architecture typically breaks down in financial models. Organizations account for retrieval and generation, but miss the orchestration infrastructure that connects them.
Query orchestration includes:
- Retriever inference: Running embedding models against incoming user queries (0.5-2 seconds per query)
- Reranking: Cross-encoder models scoring retrieved documents for relevance (0.1-0.5 seconds per query)
- LLM generation: Prompting the foundation model with context (2-5 seconds per query)
- Response synthesis: Post-processing and formatting (0.1-0.2 seconds per query)
For a customer support organization processing 10,000 customer queries daily:
- Embedding query: 10,000 queries × 0.001 (inference cost per query via batch processing) = $2/day
- Reranking top-100 candidates: 10,000 queries × 100 candidates × $0.0001 = $100/day
- LLM generation (GPT-4 at 500 tokens average): 10,000 × 500 tokens × $0.03/1K tokens = $150/day
- Infrastructure overhead: $15-$50/day
Daily query orchestration cost: $267-$302. Monthly: $8,000-$9,000.
What organizations typically miss: query volume scaling isn’t linear to cost. As you add users, query volumes increase exponentially. A system designed for 10,000 daily queries that scales to 100,000 queries doesn’t see a 10x cost increase—it’s closer to 8-12x because infrastructure overhead becomes non-linear, reranking becomes more expensive at scale, and LLM API costs compound.
Building the Complete RAG Cost Model
Now that we’ve mapped the three layers, let’s build a financial model that captures these dynamics.
The Cost Attribution Framework
Start by defining your cost categories across the full RAG stack:
1. Data Infrastructure Costs
– Document ingestion and chunking: $X/month
– Embedding pipeline (including re-embedding): $Y/month
– Vector database storage and indexing: $Z/month
– Total: $X + $Y + $Z = Data Layer Monthly Cost
2. Query Processing Costs
– Retriever compute (embedding generation): $A/month
– Reranking infrastructure: $B/month
– LLM API costs (generation): $C/month
– Orchestration overhead: $D/month
– Total: $A + $B + $C + $D = Query Processing Monthly Cost
3. Operations & Maintenance Costs
– Monitoring and observability: $E/month
– Infrastructure management: $F/month
– Model fine-tuning and optimization: $G/month
– Total: $E + $F + $G = Operations Monthly Cost
Total RAG System Monthly Cost = Data Layer + Query Processing + Operations
Modeling Cost Variables by Use Case
Costs shift dramatically based on your RAG architecture:
Customer Support Chatbots
– High query volume (100,000+ daily)
– Moderate knowledge base size (10-50M documents)
– Real-time latency requirements (sub-500ms)
– Cost driver: Query processing and reranking
– Typical monthly cost: $15,000-$40,000
Legal Contract Analysis
– Lower query volume (500-5,000 daily)
– Smaller knowledge base (1-10M documents)
– Latency tolerance (1-5 seconds acceptable)
– Cost driver: Embedding generation and LLM generation
– Typical monthly cost: $5,000-$15,000
Healthcare Clinical Decision Support
– Moderate query volume (5,000-20,000 daily)
– Large knowledge base (50-500M documents with frequent updates)
– Real-time latency requirements (sub-1 second)
– Cost driver: Vector database storage and reranking
– Typical monthly cost: $20,000-$60,000
Enterprise Search & Knowledge Retrieval
– Highly variable query volume (10,000-500,000 daily)
– Very large knowledge base (100M-1B+ documents)
– Moderate latency tolerance (1-3 seconds)
– Cost driver: Infrastructure overhead and query orchestration
– Typical monthly cost: $30,000-$150,000+
ROI Calculation: Where Organizations Get It Wrong
Traditional ROI models treat RAG as a pure cost-reduction tool. “We’ll replace 30% of our customer support team, saving $500,000 annually.” This framing ignores the actual value creation happening in RAG systems.
The Misaligned ROI Metric
Most organizations calculate RAG ROI as:
ROI = (Labor Savings – RAG Costs) / RAG Costs × 100%
This approach makes RAG look expensive because it doesn’t capture the actual business value created:
- Accuracy improvement: Faster customer resolution means fewer repeat contacts (5-15% reduction in volume)
- Time-to-insight: Sales teams close deals faster with instant competitive intelligence (2-3 day acceleration)
- Risk mitigation: Legal teams identify contract risks faster, preventing costly disputes
- Revenue enablement: Product teams make decisions faster with current market data
The Complete Value Attribution Model
A more honest RAG ROI calculation accounts for:
Direct Cost Savings
– Reduction in full-time equivalents: $X
– Reduced external consulting: $Y
– Improved operational efficiency: $Z
Revenue Enablement
– Deal acceleration (faster sales cycles): $A
– Improved customer retention (faster resolution): $B
– Premium pricing capability (differentiated service): $C
Risk & Compliance Value
– Reduced compliance violations: $D
– Faster incident response: $E
– Improved audit readiness: $F
Strategic Value
– Competitive intelligence speed: $G
– Organizational learning acceleration: $H
– Market responsiveness: $I
Total Annual Value = Direct Savings + Revenue Enablement + Risk Mitigation + Strategic Value
RAG ROI = (Total Annual Value – Annual RAG Costs) / Annual RAG Costs × 100%
Real Numbers: A Case Study in Cost Transparency
A mid-market manufacturing company deployed enterprise RAG for engineering Q&A. Here’s how the math actually worked:
Annual RAG Costs
– Vector database: $84,000
– Embedding pipeline: $48,000
– Query orchestration: $156,000
– Operations & monitoring: $36,000
– Total: $324,000
Annual Value Created
– Reduced engineering support hours (8 FTE → 5 FTE): $240,000
– Accelerated design cycles (15% faster time-to-production): $180,000 (impact on 3-month product cycle)
– Reduced production defects (12% fewer due to instant access to best practices): $320,000
– Compliance documentation improvement: $80,000
– Total: $820,000
RAG ROI = ($820,000 – $324,000) / $324,000 × 100% = 153% Year One ROI
But the company initially projected 40% ROI because they’d only counted labor savings and missed the production efficiency value.
Cost Optimization Strategies That Actually Work
Once you’re measuring costs accurately, optimization becomes tractable.
Strategy 1: Hybrid Retrieval Economics
Replacing pure vector search with hybrid retrieval (BM25 keyword search + vector search) reduces embedding costs by 30-40%. BM25 catches exact-match queries (product codes, reference numbers) without expensive embedding inference. Vector search handles semantic queries (“How do I troubleshoot connectivity issues?”).
Implementation: Add BM25 index alongside vector store. Route queries based on predictive heuristics (exact matches → BM25, semantic → vector). Cost impact: -$12,000-$18,000 monthly for typical enterprise deployments.
Strategy 2: Adaptive Reranking
Reranking every retrieved document is expensive. Implementing a two-stage reranking process (lightweight filter → heavy cross-encoder) reduces reranking costs by 50-70%.
Stage 1: Use embedding similarity score as fast filter (cost: $0)
Stage 2: Only rerank top-50 documents with cross-encoder (cost: 90% reduction vs. reranking all 1,000 candidates)
Implementation complexity: Low. Cost impact: -$8,000-$15,000 monthly.
Strategy 3: Intelligent Caching Layer
Rarely-changing queries often retrieve the same documents. Implementing a caching layer for query results and intermediate computations reduces redundant processing.
A healthcare organization implementing query result caching discovered that 35% of their queries were semantically similar, allowing them to cache results for 10 days. Cost impact: -$4,000-$8,000 monthly.
Strategy 4: Batch Embedding Operations
Processing embeddings in batches rather than real-time reduces per-embedding costs by 40-60%. Trade real-time freshness for cost: embed new documents in 4-hour batch windows rather than immediately.
Applicable for: Legal document ingestion, compliance updates, market research integration
Not applicable for: Customer support, real-time trading decisions
Cost impact: -$6,000-$12,000 monthly (depending on freshness tolerance).
The Cost-Performance Tradeoff: Making Intentional Choices
RAG optimization isn’t about minimizing cost—it’s about aligning cost with business objectives.
A customer support chatbot needs sub-500ms latency to feel responsive. This requires expensive real-time reranking and optimized retrieval infrastructure. Cost: $25,000-$40,000 monthly.
A legal contract analysis tool can tolerate 3-5 second latency. Batching queries and using lighter-weight reranking reduces cost to $8,000-$12,000 monthly.
Your cost model should make these tradeoffs explicit: “We’re paying an additional $15,000 monthly to achieve sub-500ms latency because customer experience research shows response times below 500ms reduce support resolution time by 30%.” This transforms cost from overhead into strategic investment.
Measuring What Matters: Beyond Vanity Metrics
Once you’re calculating RAG costs accurately, measure the outcomes they create:
Not just: Queries per month
But: Query-to-resolution time and its business impact
Not just: System uptime
But: Cost per successful customer outcome
Not just: Embedding precision
But: Revenue impact of faster decision-making
These outcome metrics connect RAG investments to business strategy, making ROI calculations defensible to finance leadership.
Enterprise RAG is economically sound—when costs are measured accurately and value is attributed completely. The organizations struggling with RAG ROI typically aren’t struggling with the technology; they’re struggling with honest financial modeling. Building a cost architecture that captures the complete technology stack, then layering realistic value attribution on top, transforms RAG from mysterious expense into clear competitive advantage.
Start by mapping your three-layer cost structure. Then build your value model. The gap between these two numbers is your real ROI—and your roadmap for optimization.