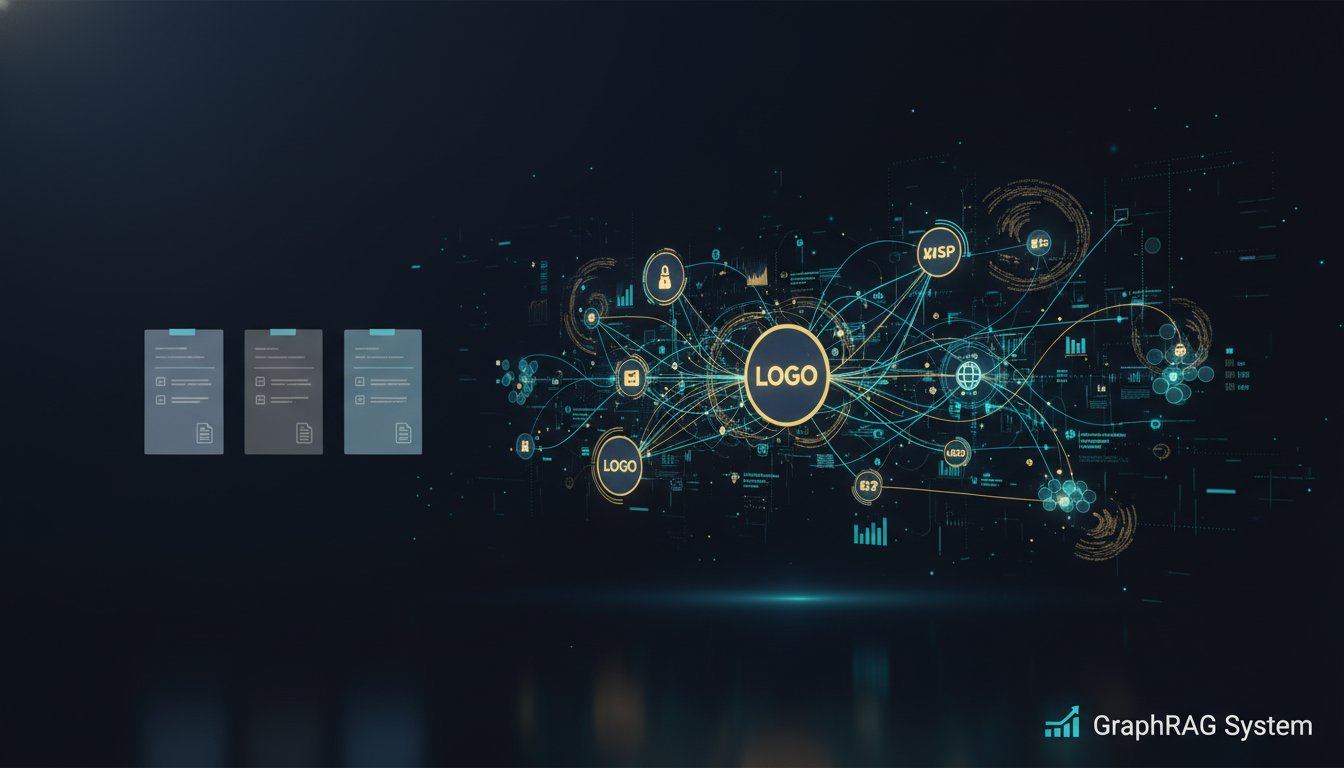
Enterprise teams are facing a consistent problem: traditional RAG systems retrieve individual documents, but complex business questions require synthesizing insights across multiple connected sources. When your CFO asks “Which suppliers are most vulnerable to geopolitical disruption based on their geographic footprint, historical delivery performance, and current market conditions?”—a simple vector search returns isolated documents. What’s needed is a system that understands the relationships between suppliers, geographic regions, delivery records, and market factors, then reasons across those connections to deliver integrated insights.
This is the fundamental gap between traditional RAG and GraphRAG systems. Traditional retrieval-augmented generation treats documents as independent entities, vectorizing and searching them individually. GraphRAG introduces a structured layer—knowledge graphs that map relationships, entities, and their interactions—enabling systems to perform multi-hop reasoning that mirrors how human analysts think through complex business problems.
The business case is compelling. Organizations implementing GraphRAG report 40-60% improvement in answer accuracy for complex queries, reduced hallucinations by constraining LLM reasoning to graph-validated relationships, and dramatic improvements in auditability since every reasoning step traces through documented entity relationships. More importantly, GraphRAG systems maintain context across multi-step reasoning chains, preventing the “lost context” problem where traditional RAG loses nuance after 3-4 retrieval hops.
The challenge isn’t whether GraphRAG delivers value—it clearly does. The challenge is architectural: Should you build knowledge graphs manually? Use LLM-powered graph extraction? Leverage existing corporate data warehouses? The answer depends on your data landscape, query complexity, and organizational capacity. This article breaks down when GraphRAG becomes your competitive edge, how to evaluate whether your use case justifies the added complexity, and the architectural patterns that separate successful deployments from expensive failures.
Understanding the GraphRAG Architecture: Beyond Document Retrieval
How Traditional RAG Falls Short on Complex Reasoning
Traditional RAG systems follow a straightforward pipeline: user query → vector embedding → semantic search → document retrieval → LLM generation. This pattern excels for single-document lookups (“What does our privacy policy say about GDPR?”) but struggles with multi-step reasoning.
Consider a healthcare use case: A clinician queries, “What treatments are recommended for patients with comorbidities similar to this patient’s profile?” Traditional RAG retrieves documents about individual treatments and conditions separately. The LLM must then synthesize these documents, but without a structured understanding of which conditions co-occur, which treatments interact, or how patient similarity is defined, the synthesis is fragile and prone to hallucination.
GraphRAG introduces a structural layer that solves this problem. Instead of treating documents as atomic units, GraphRAG systems extract entities (patient types, treatments, conditions), relationships (“treatment A contraindicated with condition B”), and attributes (efficacy rates, side effect profiles) into a knowledge graph. Now when the clinician asks the same question, the system navigates the graph: find patients similar to target patient → traverse treatment relationships → identify contraindications → synthesize across multi-step reasoning paths.
The result: answers grounded in explicitly modeled relationships, dramatically reduced hallucinations, and reasoning chains that can be audited step-by-step.
The Three-Layer Architecture of Production GraphRAG Systems
Production GraphRAG implementations typically employ three integrated layers:
Layer 1: Knowledge Graph Construction creates the structural backbone. This can happen through multiple methods: LLM-powered entity and relationship extraction from documents, structured data imports from databases, or hybrid approaches combining both. The extraction quality directly determines system performance—missed relationships create reasoning gaps, while incorrect relationships propagate errors through downstream queries.
Layer 2: Semantic Enhancement adds density to the graph. Rather than flat relationships (“treatment A → treats → condition B”), semantic enhancement assigns relationship properties: “treatment A → treats with 87% efficacy → condition B” or “supplier A → located-in → region B with geopolitical risk score 7.2/10.” This density enables fine-grained reasoning and filtering.
Layer 3: Retrieval and Reasoning executes graph traversals in response to queries. Modern GraphRAG systems don’t simply retrieve graph nodes—they identify relevant subgraphs, perform multi-hop reasoning across these subgraphs, and pass both the graph structure and retrieved nodes to the LLM for generation. The LLM now generates answers grounded in explicit relationships rather than implicit document patterns.
When GraphRAG Outperforms Traditional RAG: Decision Framework
Query Complexity as the Primary Differentiator
The decision between traditional and GraphRAG systems hinges primarily on query complexity—specifically, how many reasoning hops your typical queries require.
Single-hop queries (“What is the current price of product X?”) favor traditional RAG. These queries need one retrieval and one generation step. Adding graph complexity introduces unnecessary overhead without commensurate benefit. Traditional systems deployed at enterprise scale solve this category efficiently.
Two to three-hop queries (“Which competitors are targeting our primary customer segment and what are their pricing strategies?”) represent the transition zone where GraphRAG’s benefits begin materializing. A traditional system must retrieve multiple documents and rely on the LLM to infer relationships. A GraphRAG system explicitly models competitor → target segment relationships and pricing attributes, enabling structured traversal.
Four-or-more-hop queries (“Identify which suppliers have high vulnerability to supply chain disruption, considering geographic concentration, geopolitical risk, historical delivery reliability, and alternative supplier availability”) are where GraphRAG becomes essential. At this complexity level, traditional RAG frequently fails because LLMs struggle to maintain coherent reasoning across that many retrieval-and-inference cycles. GraphRAG’s structured approach keeps reasoning grounded throughout the chain.
Analyze your organization’s actual query patterns. If 70% of queries are single-hop, traditional RAG dominates. If 50%+ are multi-hop, GraphRAG likely delivers ROI. Between 30-50%? You’re in the evaluation zone where implementation pilot costs must be justified against query complexity reduction.
Data Structure Alignment: When Your Data Already Is a Graph
GraphRAG becomes particularly valuable when your organization’s data naturally decomposes into entities and relationships.
Supply chain optimization inherently involves supplier → product → customer → geographic region relationships. Adding GraphRAG lets you traverse this structure directly rather than hoping an LLM infers these relationships from documents.
Healthcare systems deal with patients → conditions → treatments → drug interactions → outcome histories. Clinicians’ reasoning follows this graph structure, so GraphRAG aligns perfectly with how experts actually think through problems.
Financial risk analysis involves counterparties → exposures → underlying assets → market factors. Risk analysts naturally think in terms of relationship chains, making GraphRAG alignment natural.
Regulatory compliance systems track regulations → requirements → affected departments → compliance artifacts. The compliance reasoning process is inherently graph-based: “Does regulation R1.2.3 apply to department D given our current operating structure?”
If your domain has clear entity types and relationship patterns, GraphRAG unlocks efficiency. If your data is truly unstructured (free-form text with minimal internal structure), traditional RAG may suffice, though you’re sacrificing reasoning capability.
Organizational Capability Assessment
GraphRAG deployment requires different organizational capabilities than traditional RAG.
Knowledge graph construction demands domain expertise. Someone in your organization must define what entities matter (Are suppliers entities? Supply locations? Specific supply relationships?), how relationships should be modeled, and what attributes to track. This is fundamentally different from traditional RAG, where engineers can implement the system without deep domain knowledge.
Graph quality maintenance becomes an operational requirement. As your business evolves, the graph must evolve. Traditional RAG handles this automatically—update source documents, reindex vectors, done. GraphRAG requires active graph maintenance: updating entities, adding new relationship types, and ensuring extracted information stays current.
Cross-functional collaboration intensifies. GraphRAG requires ongoing partnership between domain experts (who understand what relationships matter), data teams (who manage graph construction and updates), and engineering teams (who build the reasoning system). Organizations with siloed teams struggle with GraphRAG deployment.
Implementing GraphRAG: Architecture Patterns That Work
Pattern 1: LLM-Powered Graph Extraction (Optimal for Dynamic Domains)
This pattern leverages LLMs to automatically extract entities and relationships from unstructured documents, populating the knowledge graph dynamically.
How it works: Documents arrive → LLM extraction pipeline identifies entities (using structured output formats like JSON schemas) and relationships → extracted data populates the knowledge graph → graph queries answer user questions → reasoning paths traced through validated relationships.
Strengths: Scales to large document volumes without manual annotation. Adapts quickly as new entity types or relationships become relevant. Requires minimal upfront domain modeling.
Weaknesses: Extraction quality depends on LLM capabilities. Hallucinations in extraction create incorrect graph relationships. Requires significant filtering and validation to prevent graph pollution.
Best for: Organizations with large, continuously updating document repositories (legal firms with incoming case files, healthcare systems with new patient records, news organizations with daily content streams) where manual graph construction is infeasible.
Implementation reality: Production systems implementing this pattern typically add a validation layer: LLMs extract relationships, but human validators or consistency checkers filter for accuracy before graph insertion. Organizations like Anthropic and others report that LLM extraction quality reaches 85-92% accuracy on well-defined relationship types, but drops significantly for novel or complex relationships.
Pattern 2: Database-to-Graph Transformation (Optimal for Structured Data)
This pattern converts existing database schemas into graph structures, leveraging data already formally organized.
How it works: Existing relational or dimensional databases contain structured data → transformation pipeline maps database schemas to graph entities and relationships → business logic defines graph traversal rules → queries execute against the combined document and database graph.
Strengths: High-quality relationships guaranteed by existing database constraints. Zero extraction risk—relationships come from validated data. Simple integration for organizations with mature data warehouses.
Weaknesses: Limited to relationships already modeled in existing databases. Requires coordination with data engineering teams. Updates to database schema require graph synchronization.
Best for: Enterprises with mature data warehouses and documented business logic. Financial institutions with comprehensive transaction and counterparty databases. Supply chain organizations with ERP systems tracking supplier relationships.
Implementation reality: This is the dominant production pattern in regulated industries where data relationships must be auditable and traceable. Banks implementing supply chain RAG systems typically map their existing supplier master data, contract management systems, and risk scoring databases into graph layers. The result: graph quality is guaranteed, integration complexity is high, but reasoning reliability is exceptional.
Pattern 3: Hybrid Approach (Optimal for Most Enterprises)
Production systems typically combine both approaches: database-to-graph for core business entities and relationships, LLM extraction for nuance and context from documents.
Example: Financial risk analysis. Core entities (counterparties, exposures, asset classes) come from the risk management database. Relationships (counterparty → exposure → underlying asset) are database-sourced and guaranteed accurate. LLM extraction then adds contextual relationships from market research, news, and analyst reports: “Counterparty X faces geopolitical risk due to recent sanctions,” extracted from unstructured documents and added as relationship attributes.
This hybrid approach typically achieves: (1) high-quality core relationships from database validation, (2) contextual richness from document extraction, (3) reasonable extraction costs (only extracting incremental insights, not all relationships), and (4) graph maintenance that blends automated synchronization with structured updates.
Production Challenges: The Unspoken Costs
Graph Staleness and Update Frequency
Traditional RAG systems automatically stay current: update source documents, reindex vectors, done. GraphRAG requires active maintenance. If supplier relationships in your graph lag reality by weeks or months, decisions based on graph traversal become incorrect.
Critical metrics: Define acceptable staleness thresholds for different relationship types. Regulatory relationships should update within hours. Supplier geographic location can tolerate days. Historical performance metrics can be updated weekly. Organizations failing at this operational detail report that their GraphRAG systems become “authoritative” but “outdated,” creating governance crises.
Hallucination in Graph Extraction
LLMs hallucinate. When LLMs extract relationships from documents, they occasionally invent relationships that never existed. In traditional RAG, this causes incorrect answers to individual queries. In GraphRAG, hallucinated relationships become persistent graph nodes, contaminating reasoning across all future queries.
Mitigation: Production systems implement multi-layer validation: (1) confidence scoring on LLM-extracted relationships (keep only high-confidence extractions), (2) consistency checking (flag relationships contradicting existing graph data), (3) human review workflows for critical relationships, and (4) continuous monitoring of query success rates to detect when hallucinated relationships start degrading answer quality.
Real-world impact: Organizations implementing GraphRAG without validation layers report answer accuracy drops 20-30% after 6 months as hallucinated relationships accumulate in the graph.
Complex Relationship Types and Ambiguity
Simple relationships are easy: “supplier A located in country B.” Complex relationships are ambiguous: “Does supplier A compete with supplier B?” (Direct competitor? Indirect? Same customer segment but different geographies?). LLMs struggle with relationship ambiguity more than document content.
Production systems handle this through explicit relationship type ontologies: document exactly what each relationship means, define attributes that differentiate between similar relationship types, and constrain LLM extraction to well-defined types.
Evaluating GraphRAG: Metrics Beyond Accuracy
Query Complexity Reduction
Measure how GraphRAG reduces the mental load on query construction. Traditional RAG sometimes requires 3-4 sequential searches: “First, find competing products. Then search for their pricing. Then find our pricing for comparison.” GraphRAG should enable this as a single query: “Compare our pricing to competitors’ pricing.”
Metric: Track query reduction rate—how many traditional multi-query scenarios can GraphRAG convert to single-query resolution. Organizations report 35-50% query reduction rates, meaning analysts spend 35-50% less time formulating and executing searches.
Reasoning Path Auditability
GraphRAG’s killer advantage for regulated industries: every reasoning step is auditable. If the system recommends a financial decision, compliance teams can trace: “The system recommended X because it traversed entity path [A→B→C] with relationship properties [X1, X2, X3] derived from source [document D].”
Metric: Track compliance audit resolution time. Organizations using traditional RAG for regulated domains spend weeks reconstructing why an AI system made a particular decision. GraphRAG should reduce this to hours by providing explicit reasoning traces.
Cost Efficiency at Scale
GraphRAG increases computational cost during query execution (graph traversal + generation) but should decrease cost per valuable query resolved. If GraphRAG reduces hallucinations by 50% and eliminates false-positive queries, each real query becomes cheaper per unit of reliable insight.
Metric: Calculate cost-per-decision, not cost-per-query. If traditional RAG costs $0.50/query but 20% of answers are incorrect requiring re-search, true cost is $0.625/reliable answer. If GraphRAG costs $0.75/query but 5% error rate, cost per reliable answer is $0.79—higher per query but better ROI if the additional reliability drives business value.
The Decision: GraphRAG Implementation Roadmap
Based on your organization’s characteristics, this decision tree guides implementation:
If query complexity averages 1-2 hops AND your data is unstructured documents: Traditional RAG is sufficient. GraphRAG adds complexity without commensurate benefit. Invest in improving retrieval quality and LLM generation instead.
If query complexity averages 3+ hops AND your data naturally decomposes into entities and relationships: GraphRAG implementation is justified. Start with Pattern 2 (database-to-graph) using existing structured data, then layer in LLM extraction for unstructured nuance.
If you operate in regulated industries where auditability is non-negotiable: GraphRAG’s reasoning transparency justifies implementation costs even for moderate query complexity. The compliance and governance value alone often exceeds retrieval accuracy improvements.
If your organization has domain expertise but limited graph infrastructure: Start with a focused pilot on your highest-complexity, highest-value query type. Prove ROI on that narrow use case before enterprise-wide rollout.
The GraphRAG opportunity isn’t whether the technology works—it demonstrably improves reasoning for complex queries. The opportunity is recognizing when your organization’s questions are genuinely complex enough to justify the architectural overhead. For enterprises solving multi-hop reasoning problems at scale, GraphRAG becomes the infrastructure for competitive advantage.
The question to ask isn’t “Should we use GraphRAG?” but rather “Are we currently failing to answer our most important questions because we lack structured reasoning capability?” If the answer is yes, GraphRAG implementation moves from optional feature to strategic necessity.


