Sarah stared at her monthly churn report, a familiar knot tightening in her stomach. There it was again: a high-value account, gone. All their internal metrics had painted a picture of a healthy, engaged customer right until the cancellation email arrived. The support team had diligently closed their tickets, the account manager had their regular check-ins, and product usage seemed stable. From the outside, everything was fine. But the data was lying—or rather, it wasn’t telling the whole story. The problem wasn’t a lack of information; it was a lack of connection. Her systems could see the individual trees—a support ticket here, a feature request there—but were completely blind to the forest, the subtle, interconnected narrative of a customer slowly losing faith.
This is the silent killer in many SaaS businesses. We are drowning in data from countless touchpoints: CRM entries in Salesforce, support conversations in Zendesk, usage logs in Mixpanel, and community discussions on public forums. Yet, we still get blindsided by churn. The reason is that our traditional analytical tools, and even first-generation AI systems built on basic Retrieval-Augmented Generation (RAG), are fundamentally flawed for this task. They operate on keyword matching and semantic similarity, treating each piece of data as an isolated event. They can find documents about a problem, but they can’t understand the causal chain of events that is the problem. They can’t see that a minor bug report from three months ago, combined with a failed data export last month, and a recent forum comment about a competitor’s new feature, are all part of the same customer’s journey toward the exit.
This is where a more sophisticated approach is required. We need to move beyond simple document retrieval and into the realm of relationship discovery. Enter GraphRAG, a next-generation architecture that maps your scattered business data into a living, connected knowledge graph. Instead of just searching for text, this technology traverses the relationships between your customers, their support tickets, the features they use, and the issues they encounter. It uncovers the hidden patterns and developing stories that signal churn risk long before a customer makes their final decision. But insight alone is not enough. The true revolution comes when you pair this predictive power with automated, personalized action. By connecting a GraphRAG system to a generative AI video platform like HeyGen, you can close the loop—transforming a complex churn signal into a timely, human-centric video message that re-engages a customer at the most critical moment. This article will guide you through this powerful new paradigm, showing you how to build a system that doesn’t just report on the past, but actively shapes the future of your customer relationships.
The Hidden Story of Churn: Why Traditional RAG Falls Short
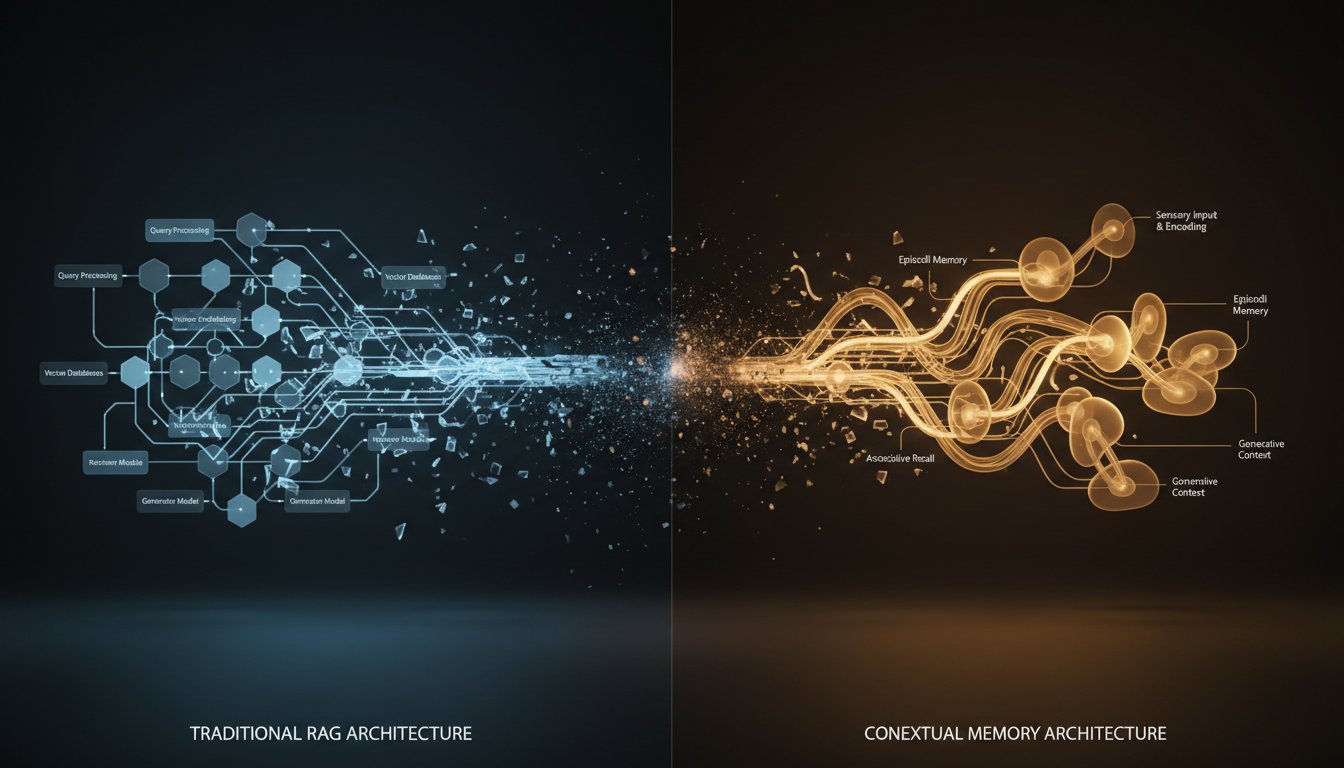
For years, Retrieval-Augmented Generation (RAG) has been celebrated as the key to making Large Language Models (LLMs) enterprise-ready. By providing the model with relevant documents from a company’s private knowledge base, RAG helps produce factual, context-aware answers. However, when applied to complex, multi-faceted problems like customer churn, the standard vector-search-based RAG architecture begins to show its cracks.
The Limitations of Vector Search for Complex Problems
Standard RAG relies on vector databases to find information. It converts documents into numerical representations (vectors) and finds chunks of text that are semantically similar to a user’s query. This is incredibly effective for answering direct questions like, “What is our refund policy?” But it fails when the real insight lies in the relationship between data points, not within a single document.
Consider this scenario: a customer submits a support ticket in Zendesk with the text, “My monthly report generation is timing out.” A week later, the same customer posts on a community forum, “Trying to export our Q3 data is painfully slow, it always fails.” A traditional RAG system, queried about this customer’s health, would see two distinct, semantically different issues. It would miss the critical link: both problems stem from the same underlying performance issue with the data processing engine. It can’t connect the dots because it’s playing a game of matching words, not understanding context.
The Data Silo Problem
This limitation is magnified by the fact that churn signals are rarely located in one place. The true story of a customer’s dissatisfaction is fragmented across a half-dozen platforms. Their declining product usage is in your analytics software, their unresolved feature requests are in Jira, their contract value is in Salesforce, and their passive-aggressive comments about your UI are buried in a Slack community.
A vector-based RAG system struggles to synthesize these disparate sources into a single, coherent narrative. It can retrieve data from each silo individually, but it cannot construct the overarching story. As noted in the AWS Machine Learning Blog, this is a fundamental architectural challenge: “By traversing these relationships, GraphRAG can uncover insights that are invisible to vector-only RAG systems.” Without the ability to see these connections, you’re left with a collection of isolated facts that fail to reveal the impending danger.
Introducing GraphRAG: Your Churn Prediction Co-pilot
If traditional RAG is like asking a librarian to find you books on a topic, GraphRAG is like asking a team of detectives to piece together a complex case. It’s designed specifically to uncover the hidden relationships in your data, providing the rich, interconnected context needed to understand and predict sophisticated outcomes like churn.
What is a Knowledge Graph? (A Quick Primer)
At the heart of GraphRAG is a knowledge graph. Unlike a traditional database that stores data in rows and columns, a knowledge graph stores it as a network of nodes and edges. It’s surprisingly intuitive:
- Nodes: These are the entities or nouns in your business. A node could be ‘Customer ABC,’ ‘Support Ticket #4567,’ ‘Feature X,’ or ‘Account Manager John Doe.’
- Edges: These are the relationships or verbs that connect the nodes. An edge could be ‘SUBMITTED’ (connecting a customer to a ticket), ‘MENTIONED’ (connecting a ticket to a feature), or ‘ASSIGNED_TO’ (connecting a ticket to an account manager).
By mapping your business data this way, you create a rich, queryable model of your entire customer ecosystem. You can visually see and computationally analyze how everything connects.
How GraphRAG Works
The process moves beyond simple retrieval to intelligent discovery. It’s a form of what experts are now calling “Context Engineering,” which Geeky Gadgets defines as “the art and science of designing, refining, and managing the contextual information provided to large language models (LLMs) to elicit the most accurate, relevant, and useful responses.” GraphRAG is context engineering at its most powerful.
Here’s the workflow:
- Ingest & Model: Data from your various platforms—Zendesk, Salesforce, Jira, product analytics—is ingested and transformed into the graph structure. A new support ticket doesn’t just become a row in a table; it becomes a ‘Ticket’ node connected to a ‘Customer’ node and a ‘Feature’ node.
- Query & Traverse: When you want to assess churn risk, you don’t just search for keywords. You ask complex questions that traverse the graph, like “Find all high-value customers who have submitted multiple critical bug tickets related to the same core feature and have also shown a decrease in product usage over the last 30 days.” The system follows the edges from customers to tickets to features to usage data to find matches.
- Synthesize & Augment: The rich, interconnected context discovered during the traversal—the complete story—is then packaged and fed to an LLM. The LLM doesn’t just get a list of documents; it gets a narrative. Its resulting summary and analysis are exponentially more insightful because it’s based on a holistic understanding of the customer’s experience.
A Practical Workflow: From Churn Signal to Personalized Video
Understanding the theory is one thing; putting it into practice is another. A GraphRAG system becomes truly transformative when you connect its predictive insights to an automated action engine. Here is a conceptual workflow for building a closed-loop churn prevention system using GraphRAG and HeyGen’s AI video platform.
Step 1: Building Your Customer Knowledge Graph
First, you need to consolidate your data. Identify your key data sources that contain pieces of the churn story. This typically includes:
- CRM (e.g., Salesforce): For contract value, renewal dates, and records of sales or success interactions.
- Support Desk (e.g., Zendesk): For ticket volume, severity, categories, and resolution times.
- Product Analytics (e.g., Mixpanel): For user engagement, feature adoption, and recent changes in usage patterns.
The next step is to define your graph schema. You would establish nodes like Customer, Ticket, Feature, User, and Employee. Then, you’d define the edges that connect them, such as HAS_CONTRACT, SUBMITTED_TICKET, REPORTED_BUG_IN, and USAGE_DECLINED.
Step 2: Identifying At-Risk Customers with Graph Traversal
With your knowledge graph in place, you can now run powerful, automated queries to proactively identify at-risk customers. Instead of waiting for a health score to turn red, you can hunt for complex behavioral patterns. For example, a daily automated query could be:
- “Return all customers on the ‘Enterprise’ plan who have logged more than two tickets with ‘critical’ priority in the last 60 days, where at least one ticket is still unresolved, and whose weekly active users have dropped by over 20% month-over-month.”
This is a query that is virtually impossible for a traditional analytics or RAG system to answer in a single, automated step. The GraphRAG system, however, can traverse its network of nodes and edges to instantly surface a list of customers who fit this high-risk profile.
Step 3: Automating Personalized Outreach with HeyGen
This is where insight turns into action. An insight sitting in a dashboard is useless. The crucial final step is to engage the at-risk customer in a way that is human, scalable, and immediate. Once your GraphRAG system flags a customer, an automated workflow triggers the HeyGen API.
The system synthesizes the specific reasons for the churn risk into a concise summary. This summary then becomes the basis for a dynamic video script. For example:
- Input to HeyGen API:
Avatar: [Avatar ID for Assigned Account Manager]Customer Name: “Global Tech Inc.”Specific Issues: “challenges with the reporting dashboard” and “slow API performance.”Action Taken: “Our top engineering team is actively implementing a patch, and I’ve applied a 15% credit for next month as an apology.”
The HeyGen API uses this data to generate a unique, personalized video. The account manager’s AI avatar looks into the camera and says, “Hi Global Tech team. I was personally reviewing your account and noticed you’ve run into some real challenges with the reporting dashboard and slow API performance. I sincerely apologize for the frustration this has caused. I wanted to let you know personally that our top engineering team is actively implementing a patch. As a further apology, I’ve applied a 15% credit to your account for next month. We truly value your partnership.”
This hyper-personalized video can be automatically emailed to the primary contact, transforming a moment of risk into a moment of proactive, high-touch support that reinforces your commitment to their success.
She looked at her morning alerts. Not a churn report, but a proactive notification from her new GraphRAG system: “Customer XYZ flagged as high churn risk due to unresolved critical tickets and declining usage. A personalized video message from their account manager has been generated and is awaiting your approval.” Sarah clicks ‘send.’ She’s no longer a historian of lost accounts; she’s an architect of customer loyalty. By combining the deep-context discovery of GraphRAG with the scalable, human-touch outreach of AI-generated video, you can finally get ahead of churn. You can stop reacting to the past and start building a more resilient future, one personalized interaction at a time. The first step is turning your data into proactive conversations. To start turning churn risks into retention opportunities with powerful, personalized video messages, Try HeyGen for free now.


