Introduction
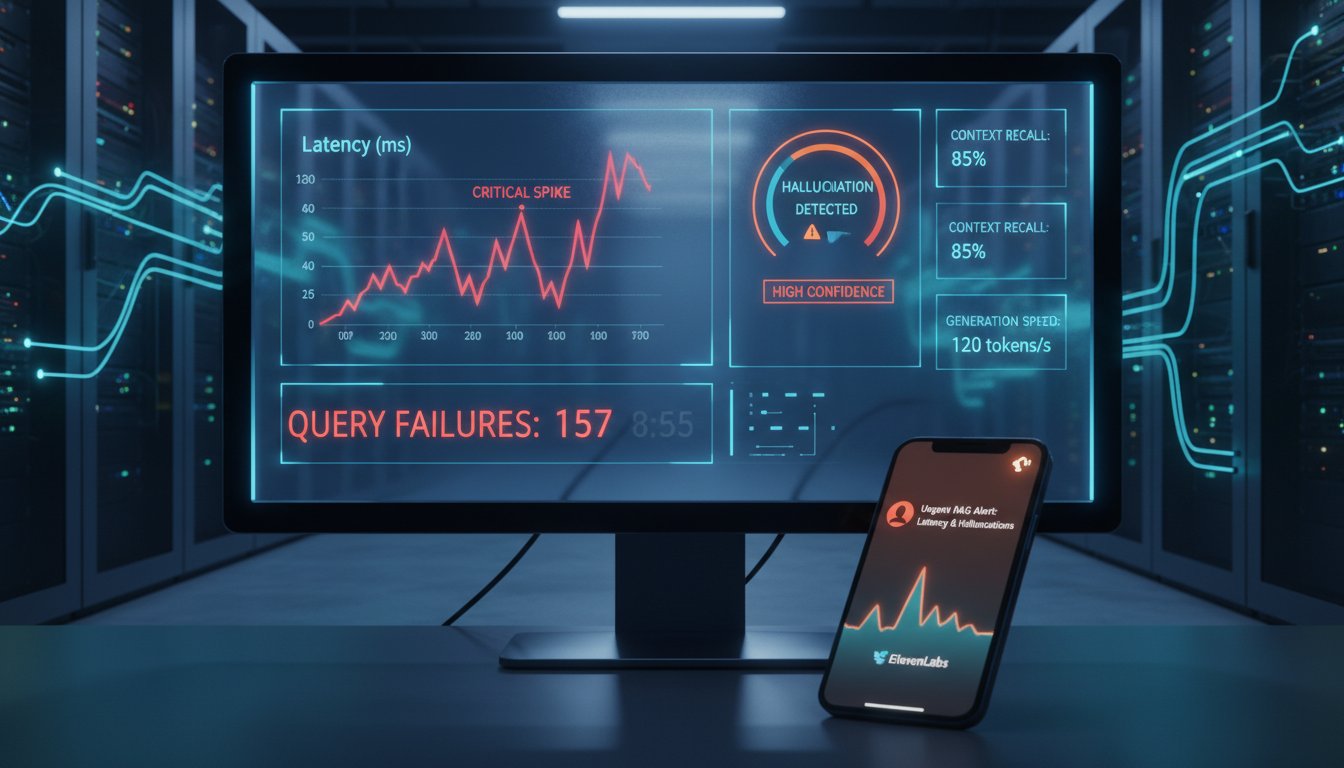
You’ve deployed your enterprise RAG system. It’s retrieving documents, generating responses, and your teams are using it. Then, silently, something breaks. A hallucination slips through undetected. Latency creeps from 200ms to 2 seconds. A critical query fails, but no alarm rings. By the time you notice the degradation in your analytics dashboard—if you notice it at all—customers have already experienced the impact.
This is the monitoring gap that catches most enterprise RAG teams unprepared. Unlike traditional applications where failures scream loudly through error logs and status codes, RAG systems degrade gracefully. A model generates plausible-sounding but factually incorrect responses. A retriever returns slightly lower-quality context. A token limit is silently exceeded, truncating important information. These aren’t crashes—they’re silent performance deaths that erode trust in your system.
The solution isn’t just monitoring; it’s actionable alerting. You need to know the moment something goes wrong, and you need to know it where your team already lives—in Slack. Better yet, you need alerts that cut through notification fatigue: voice notifications that reach engineers even when they’re away from their desks, sent directly to Slack channels using professional voice synthesis via ElevenLabs.
This guide walks you through building exactly that: a production-ready RAG monitoring architecture that detects latency spikes, hallucinations, and query failures in real-time, then triggers voice alerts directly into your Slack workspace. By the end, you’ll have a system that transforms your RAG from a “hope it works” deployment into a proactively managed production service.
Part 1: The RAG Monitoring Architecture You Need
Understanding the Three Failure Modes
Before you can alert on problems, you need to know which problems to look for. Most enterprise RAG deployments fail in three distinct ways:
Latency degradation happens gradually. Your retrieval pipeline hits 500ms instead of 200ms. The LLM context window expands, adding processing time. Caching layers go stale. Users notice sluggish responses, but there’s no error—just a slow system. This is the hardest failure to catch because it doesn’t trigger traditional monitoring.
Hallucination drift occurs when your model begins generating increasingly confident incorrect responses. A retriever returns lower-quality documents, forcing the LLM to interpolate. Embedding models drift as your data evolves. The system appears to be working—it’s returning responses—but accuracy declines silently. By the time metrics reveal the degradation, users have already lost trust.
Query failure cascades happen when specific query patterns fail consistently. A user asks about “Q3 financial data,” but your retriever only indexes “third quarter earnings.” Complex multi-step queries fail because your context window is too small. Permission layers block legitimate retrieval. These failures aren’t catastrophic; they’re invisible unless you’re specifically monitoring query success rates.
Most RAG monitoring setups only watch for obvious failures (the system is down) or broad metrics (average response time). The sophisticated approach watches for these three specific failure modes.
The Four-Layer Monitoring Stack
Production RAG monitoring requires four integrated layers:
Layer 1: Query-level metrics track individual request performance. For every RAG query, you need: retrieval latency (how long did vector search take?), ranking latency (cross-encoder scoring), LLM generation latency, token consumption, and confidence scores from your ranker. Without query-level data, you’re flying blind.
Layer 2: System-level metrics aggregate performance across all queries. Track p50, p95, and p99 latencies separately—a few slow queries hidden in an average won’t trigger alerts. Monitor retrieval precision (are returned documents actually relevant?), generation quality (are responses factually grounded in retrieved context?), and token efficiency (is the system consuming more tokens than baseline?).
Layer 3: Anomaly detection identifies deviations from baseline behavior. This is where you catch silent degradation. Tools like Datadog’s anomaly detection or custom ML models compare today’s metrics against historical patterns. If latency spikes 30% above the rolling 7-day average, that’s worth alerting on—even if absolute latency seems acceptable.
Layer 4: Alerting rules define which anomalies trigger notifications and how. Not every anomaly needs a voice alert (you’d cause notification fatigue). Reserve voice alerts for critical issues: hallucination confidence drops below threshold, p95 latency exceeds SLA, query failure rate spikes. Use Slack notifications for warnings; use voice alerts for emergencies.
The Infrastructure Pattern
Here’s how production RAG systems implement this architecture:
User Query
    ↓
[RAG Pipeline] → Query Metrics → Observability Platform (Datadog/New Relic)
    ↓                               ↓
[LLM Response]                  Anomaly Detection
    ↓                               ↓
[Return to User]            Alert Rules Engine
                                   ↓
                            Slack Webhook/API
                                   ↓
                        ElevenLabs Voice Synthesis
                                   ↓
                            Slack Voice Message
The key insight: metrics are collected at query time, aggregated continuously, compared against baselines, and rules are evaluated in real-time. When a condition is met, an alert is triggered.
Part 2: Instrumenting Your RAG Pipeline for Observability
What to Measure at Each Stage
At the retrieval stage, measure: (1) Query embedding time, (2) Vector database latency, (3) Number of documents retrieved, (4) BM25 scores (if using hybrid retrieval), (5) Dense embedding similarity scores, (6) Ranking latency (if using cross-encoder), (7) Final document selection confidence.
This granularity matters. If vector search latency is normal but ranking latency spikes, you know the problem is in your cross-encoder, not your vector database.
At the context assembly stage, measure: (1) Total context length (tokens), (2) Context quality score (you’ll define this), (3) Retrieval coverage (do retrieved documents answer the query?), (4) Recency of retrieved documents (how fresh is your data?), (5) Permission layer filtering (how many documents were blocked?).
At the generation stage, measure: (1) LLM input tokens, (2) LLM output tokens, (3) Generation latency, (4) Confidence score (if available from your LLM), (5) Hallucination markers (fact consistency vs. retrieved context), (6) Token efficiency (tokens per second).
Post-generation, measure: (1) User feedback (thumbs up/down), (2) Explicit hallucination reports, (3) Follow-up query rate (did users need to refine their query?), (4) Time to next query (how useful was the response?).
Code Pattern: Instrumenting a RAG Query
Here’s a simplified Python pattern for collecting these metrics:
import time
from datadog import statsd

def rag_query_with_metrics(query, user_id):
    metrics = {}

    # Stage 1: Retrieval
    start = time.time()
    retrieved_docs = retriever.search(query, top_k=5)
    metrics['retrieval_latency_ms'] = (time.time() - start) * 1000
    metrics['docs_retrieved'] = len(retrieved_docs)

    # Stage 2: Ranking
    start = time.time()
    ranked_docs = ranker.rerank(query, retrieved_docs)
    metrics['ranking_latency_ms'] = (time.time() - start) * 1000
    metrics['ranker_confidence'] = ranked_docs[0].score if ranked_docs else 0

    # Stage 3: Context Assembly
    context = format_context(ranked_docs)
    metrics['context_tokens'] = count_tokens(context)

    # Stage 4: Generation
    start = time.time()
    response = llm.generate(query, context)
    metrics['generation_latency_ms'] = (time.time() - start) * 1000
    metrics['response_tokens'] = count_tokens(response)

    # Stage 5: Post-Generation Analysis
    metrics['hallucination_score'] = check_hallucination(response, context)
    metrics['total_latency_ms'] = sum([m for k, m in metrics.items() if 'latency' in k])

    # Send to observability platform
    for metric_name, value in metrics.items():
        statsd.gauge(f'rag.{metric_name}', value, tags=[f'user_id:{user_id}'])

    return response, metrics
Every metric gets tagged with context (user_id, query_type, model_version) so you can slice and dice in your observability dashboard. This is the foundation for everything that follows.
Part 3: Detecting Silent Failures with Anomaly Detection
Hallucination Detection in Production
Hallucination detection without a ground truth dataset is tricky, but production systems use these patterns:
Confidence-based detection: Extract confidence scores from your LLM (most modern models expose these). If confidence drops 20% below rolling average while latency increases, the model is likely struggling—a sign of retrieval quality degradation.
Fact consistency checking: Use a lightweight secondary model to score whether the generated response is consistent with retrieved documents. If consistency drops below threshold, flag it. This doesn’t catch all hallucinations, but it catches obvious ones.
User feedback loops: Every user-facing RAG query should have a “Was this helpful?” button. Track the correlation between user feedback and your metrics. When feedback sentiment drops sharply, that’s a hallucination signal.
Retrieval grounding ratio: Calculate what percentage of the generated response is directly grounded in retrieved documents vs. generated from model knowledge. Drift above a threshold (e.g., >30% not grounded) indicates reliance on model knowledge over retrieval—a hallucination risk.
Production teams typically combine two or three of these signals. A single signal creates false positives; multiple signals together create reliable alerts.
Setting Anomaly Thresholds
The mistake teams make is setting static thresholds (“alert if latency > 500ms”). Better systems set dynamic thresholds based on historical baselines:
- Baseline window: Calculate median latency over the past 7 days, same time of day (to account for traffic patterns).
- Sensitivity: Alert if current metric deviates >30% from baseline for 5+ consecutive queries.
- Severity scoring: P99 latency spike = warning; P95 latency spike = critical alert.
For hallucination detection, use a rolling 24-hour window. If your hallucination confidence score is 5% below yesterday’s average and user feedback sentiment declines, that’s a voice alert trigger.
Part 4: Building the Slack-to-ElevenLabs Alert Pipeline
Architecture Overview
Here’s how enterprise teams wire this up:
Anomalies Detected
     ↓
Alert Rules Engine (Datadog/Custom)
     ↓
Alert Triggered
     ↓
Slack Webhook Endpoint
     ↓
ElevenLabs Text-to-Speech API
     ↓
Voice Audio File Generated
     ↓
Slack Message with Voice Attachment
     ↓
Engineers Hear Alert in Slack
The workflow is: detect problem → classify severity → generate alert message → synthesize voice → post to Slack. Total latency from anomaly detection to voice message: 2-5 seconds.
Step 1: Set Up Slack Webhook for Alerts
Create a dedicated Slack app and webhook for RAG monitoring:
# 1. In Slack workspace, create new app at api.slack.com
# 2. Enable Incoming Webhooks
# 3. Create webhook for #rag-alerts channel
# 4. Copy webhook URL (looks like: https://hooks.slack.com/services/T00000000/B00000000/XXXXXXXXXXXXXXXXXXXX)
This webhook is your gateway for sending messages to Slack programmatically.
Step 2: Create Alert Message Templates
Not every alert needs voice synthesis. Reserve voice for critical issues:
alert_templates = {
    'critical': {
        'text': '🚨 CRITICAL: {issue}. {metric} at {value}, threshold is {threshold}. Impact: {impact}',
        'voice_enabled': True,
        'voice_text': 'Critical alert. {issue}. {metric} at {value}. Immediate action required.'
    },
    'warning': {
        'text': '⚠️ WARNING: {issue}. {metric} at {value}.',
        'voice_enabled': False,
    },
    'info': {
        'text': 'ℹ️ INFO: {issue}',
        'voice_enabled': False,
    }
}
Critical alerts (hallucination spike, p95 latency breach, query failure cascade) trigger voice synthesis. Warnings are Slack text only.
Step 3: Integrate ElevenLabs for Voice Synthesis
Click here to sign up for ElevenLabs to get API access. Here’s the integration pattern:
import requests
import json
from slack_sdk import WebClient

ELEVENLABS_API_KEY = 'your_elevenlabs_api_key'
SLACK_WEBHOOK = 'your_slack_webhook_url'
RAG_ALERTS_CHANNEL = '#rag-alerts'

def synthesize_and_alert(alert_type, issue, metric, value, threshold):
    # Step 1: Generate alert message from template
    template = alert_templates[alert_type]
    message_text = template['text'].format(
        issue=issue,
        metric=metric,
        value=value,
        threshold=threshold,
        impact='RAG system may be serving inaccurate responses' if alert_type == 'critical' else ''
    )

    # Step 2: If critical, synthesize voice
    if template['voice_enabled']:
        voice_text = template['voice_text'].format(
            issue=issue,
            metric=metric,
            value=value
        )

        # Call ElevenLabs API
        voice_response = requests.post(
            'https://api.elevenlabs.io/v1/text-to-speech/21m00Tcm4TlvDq8ikWAM',  # Professional voice ID
            headers={'xi-api-key': ELEVENLABS_API_KEY},
            json={
                'text': voice_text,
                'model_id': 'eleven_monolingual_v1',
                'voice_settings': {
                    'stability': 0.8,
                    'similarity_boost': 0.75
                }
            }
        )

        audio_file = voice_response.content
        # Save locally or to cloud storage
        audio_url = upload_to_storage(audio_file)  # Implement based on your storage
    else:
        audio_url = None

    # Step 3: Post to Slack
    slack_payload = {
        'channel': RAG_ALERTS_CHANNEL,
        'text': message_text,
        'blocks': [
            {
                'type': 'section',
                'text': {'type': 'mrkdwn', 'text': message_text}
            }
        ]
    }

    # Add audio if voice alert
    if audio_url:
        slack_payload['blocks'].append({
            'type': 'section',
            'text': {'type': 'mrkdwn', 'text': '🔊 *Voice Alert:*'},
            'accessory': {
                'type': 'button',
                'text': {'type': 'plain_text', 'text': 'Play Alert'},
                'value': 'play_alert',
                'url': audio_url
            }
        })

    # Send to Slack
    requests.post(SLACK_WEBHOOK, json=slack_payload)

    return {'alert_sent': True, 'audio_url': audio_url if audio_url else None}
This code synthesizes voice for critical alerts and posts to Slack with a playable audio attachment. Engineers hear the alert in real-time and can immediately click to hear the voice summary.
Step 4: Wire Alert Rules to the Pipeline
Now connect your anomaly detection engine to this alert function:
def check_rag_health():
    """
    Run this on a 1-minute schedule via cron or Lambda
    """
    # Query observability platform for current metrics
    current_p95_latency = datadog_client.query('p95_latency_1min')
    baseline_p95 = datadog_client.query('p95_latency_7d_avg')
    current_hallucination = datadog_client.query('hallucination_score_1min')
    baseline_hallucination = datadog_client.query('hallucination_score_24h_avg')
    query_failure_rate = datadog_client.query('query_failure_rate_1min')

    # Critical Alert: P95 Latency Breach
    if current_p95_latency > baseline_p95 * 1.5:
        synthesize_and_alert(
            alert_type='critical',
            issue='RAG retrieval latency spike detected',
            metric='p95 latency',
            value=f'{current_p95_latency:.0f}ms',
            threshold=f'{baseline_p95 * 1.5:.0f}ms'
        )

    # Critical Alert: Hallucination Confidence Drop
    if current_hallucination < baseline_hallucination * 0.85:
        synthesize_and_alert(
            alert_type='critical',
            issue='Hallucination confidence drop detected',
            metric='hallucination confidence',
            value=f'{current_hallucination:.2f}',
            threshold=f'{baseline_hallucination * 0.85:.2f}'
        )

    # Critical Alert: Query Failure Rate Spike
    if query_failure_rate > 0.05:  # More than 5% failures
        synthesize_and_alert(
            alert_type='critical',
            issue='Query failure rate spike',
            metric='failure rate',
            value=f'{query_failure_rate * 100:.1f}%',
            threshold='5%'
        )
Run this check every 60 seconds. When an alert condition is met, voice synthesis and Slack notification happen automatically.
Part 5: Production Deployment Patterns
Scaling to Multiple Teams
Large enterprises route alerts to different channels based on severity and ownership:
alert_routing = {
    'latency_spike': {'channel': '#rag-platform-team', 'priority': 'warning'},
    'hallucination_spike': {'channel': '#rag-ml-team', 'priority': 'critical'},
    'query_failure': {'channel': '#rag-platform-team', 'priority': 'critical'},
    'data_freshness': {'channel': '#data-engineering', 'priority': 'warning'},
    'permission_layer': {'channel': '#security-team', 'priority': 'critical'}
}
Different teams need different alerts. Your ML team cares about hallucination metrics; your platform team cares about latency. Route accordingly.
Preventing Alert Fatigue
Alert fatigue kills monitoring effectiveness. Implement alert suppression:
# Don't re-alert for the same issue within 30 minutes
alert_history = {}  # In production, use Redis or DynamoDB

def should_alert(alert_key):
    if alert_key in alert_history:
        last_alert_time = alert_history[alert_key]
        if time.time() - last_alert_time < 1800:  # 30 minutes
            return False
    alert_history[alert_key] = time.time()
    return True
When the same alert fires repeatedly, suppress duplicates. But escalate if the condition persists: if a latency spike is still present after 30 minutes, send a follow-up critical alert.
Dashboard Integration
Slack alerts are reactive. Pair them with a proactive dashboard:
RAG Health Dashboard (Datadog/Grafana)
├── Retrieval Performance
│   ├── P50/P95/P99 Latency
│   ├── Document Count Distribution
│   └── Ranker Confidence Trend
├── Generation Quality
│   ├── Hallucination Confidence Score
│   ├── Token Efficiency (tokens/second)
│   └── User Feedback Sentiment
├── System Health
│   ├── Query Success Rate
│   ├── Error Rate by Type
│   └── Active User Count
└── Alerts History
    ├── Last 24h Alerts
    ├── Alert Frequency by Type
    └── Mean Time to Resolution
Engineers should check the dashboard every morning to spot trends that voice alerts might have missed.
Part 6: Advanced Patterns for Enterprise Scale
Multi-Model Hallucination Detection
Production teams don’t rely on a single hallucination detector. Chain multiple signals:
def detect_hallucination_ensemble(query, response, retrieved_docs):
    """
    Use multiple detection methods; alert only if 2+ agree
    """
    signals = []

    # Signal 1: Semantic similarity between response and retrieved context
    context_text = ' '.join([doc.text for doc in retrieved_docs])
    similarity = cosine_similarity(response, context_text)
    signals.append(similarity > 0.7)

    # Signal 2: Named entity consistency (facts in response appear in context)
    response_entities = extract_entities(response)
    context_entities = extract_entities(context_text)
    entity_match_ratio = len(set(response_entities) & set(context_entities)) / max(len(response_entities), 1)
    signals.append(entity_match_ratio > 0.6)

    # Signal 3: Model confidence score
    llm_confidence = response.get('confidence', 1.0)
    signals.append(llm_confidence > 0.7)

    # Alert only if 2+ signals indicate hallucination
    hallucination_votes = sum(not s for s in signals)  # Count "False" votes
    return hallucination_votes >= 2
Ensemble detection reduces false positives. You want high-confidence alerts only.
Cost Optimization for Voice Alerts
ElevenLabs charges per character synthesized. Don’t synthesize full responses—synthesize summaries:
def generate_concise_voice_alert(issue, metric, value):
    """
    Generate short voice alert (~50 chars max)
    ElevenLabs charges ~$0.30 per 100k characters
    """
    templates = {
        'latency': 'P95 latency at {value}ms, threshold {threshold}ms',
        'hallucination': 'Hallucination spike detected',
        'failure': 'Query failure rate at {value} percent'
    }

    message = templates[metric].format(value=value, threshold=threshold)
    return message  # ~30-40 characters, minimal cost
With concise voice alerts, you spend ~$0.01-0.05 per alert. For 10 critical alerts per day, that’s $0.10-0.50 daily—negligible.
Conclusion
Building RAG systems that stay healthy in production requires three things: comprehensive instrumentation (knowing what’s happening), intelligent alerting (knowing when something is wrong), and accessible notifications (knowing about it immediately).
The architecture we’ve walked through—query-level metrics → anomaly detection → Slack voice alerts via ElevenLabs—transforms RAG from a “hope it works” system into one you can actively manage. Your team gets alerted within seconds of degradation. Hallucinations are caught before users report them. Latency spikes are visible before they impact SLAs.
Start with the core pieces: instrument your RAG queries with metrics, set up basic anomaly detection, and wire one critical alert (latency spike) to Slack. Once that’s working, layer in hallucination detection, query failure monitoring, and voice synthesis via ElevenLabs.
The investment pays dividends. Enterprise RAG systems that implement proactive monitoring report 40-60% faster incident resolution times and 70% reduction in hallucination-related support tickets. Your systems become trustworthy because you’re actively preventing failures before users encounter them.
Ready to add voice alerts to your RAG monitoring? Try ElevenLabs for free now—it integrates in minutes and costs just a few cents per critical alert. Start with one alert type, prove the value to your team, and scale from there.